Note
Access to this page requires authorization. You can try signing in or changing directories.
Access to this page requires authorization. You can try changing directories.
I spent two weeks between full time projects (still working on the 2 part time projects I am on) looking back at the build logs from the past 6 months (or so) trying to figure out what metrics we have, what we should track going forward, and what goals we should have for these metrics. I came up with some interesting findings.
First, overall unit test code coverage was OK, but not as high as I would like on my projects. Of course, these numbers included generated code, view code, and other things that I usually filter out. Also coverage was fairly flat. For the most part, as we added code, we added tests. This, I think is much better than one of the alternatives, having coverage drop over the course of the project.
Here is coverage for the Application Blocks in WCSF, without axis labels. The Y axis starts at 76% (not zero).
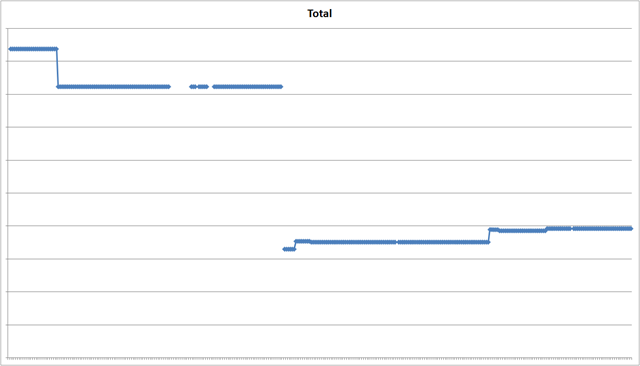
You will see that there was a noticeable drop in coverage part way through the project. That was when we added a new library of AJAX controls. Before the change was made we knew this would happen and accepted the risk. I also worked with the testers on my team to mitigate the risk via more acceptance tests and careful code reviews. And after the change, we trended up, slowly, over time.
In addition to watching coverage over time, I was able to come up with a few indices to watch going forward. Thanks to NDepend, a little bit of work parsing build logs, and Linq, I was able to create seven indices, three of which I will be watching closely on future projects:
- Cyclomatic Complexity
- Afferent Coupling
- Efferent Coupling
If you want a definition for any of these, check out the NDepend site. The index for each of these is the average of the top 10 worst values by type.
Here is a graph of these indices over time for another, un-named project (without the axis labels)
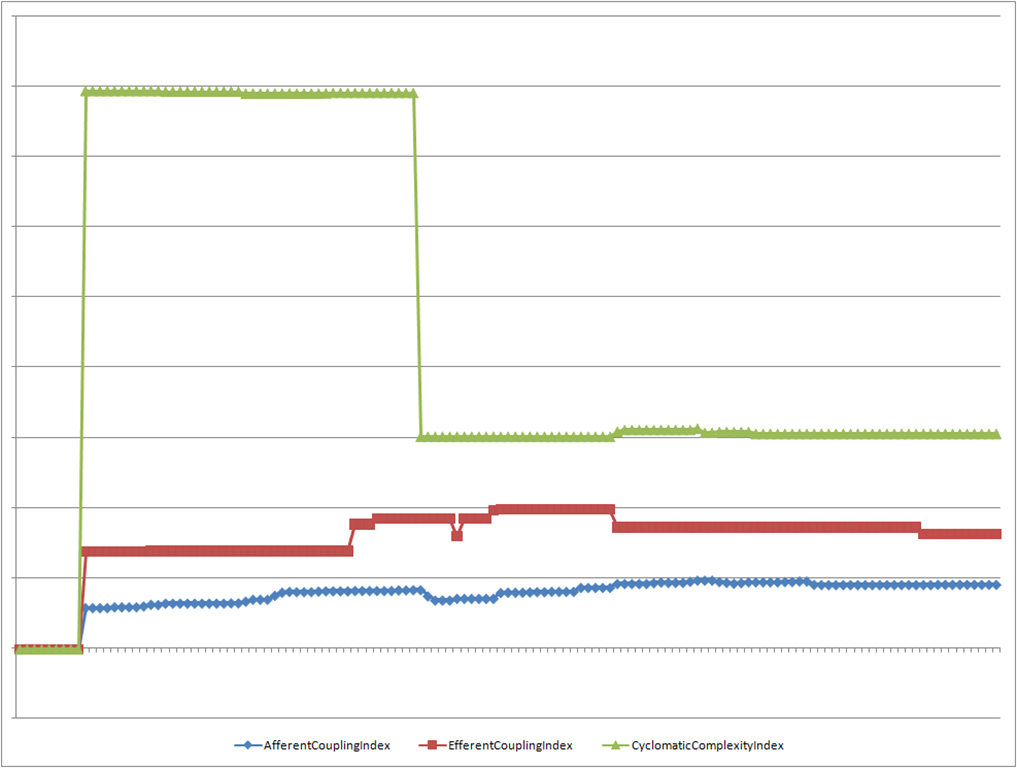
You can see that the first few builds did not have NDepend hooked up properly. Then everything tracks along, relatively stable until about 40% through the project. The Dev Lead on the project was able to tell me what happened on the day that the Cyclomatic Complexity dropped drastically. It was a big change to simplify things.
Do these graphs, numbers, and indices (and all the others that I pulled from the data, but did not share yet) tell me the whole story as far as code quality? Of course not. However, these can all be used as indicators. If complexity trends sharply up over time, there may be a problem we need to investigate. If it stays low, there can still be other problems hidden. However, a little information is better than none.
Now, on to the next project...
Comments
- Anonymous
April 17, 2008
PingBack from http://www.ademiller.com/blogs/tech/2008/04/what-to-do-with-all-that-data/