Using IntelliTrace outside the IDE - 64-bit Applications
IntelliTrace is one of my favorite features in Visual Studio Ultimate 2010, alongside the debugger and the new C++ IntelliSense and VC++ libraries.
There are some neat things that I've done using IntelliTrace without the IDE at all, such as collecting from 64-bit applications, monitoring test runs that I can't use Microsoft Test Manager to test, and much more.
I'm going to show you how to use the command line to collect and IntelliTrace log from a 32-bit or 64-bit process.
Locating the Collection Plan
Inside of the "Team Tools\TraceDebugger Tools" directory beneath the Visual Studio 2010 installation, you will find two files:
IntelliTrace.exe
en\CollectionPlan.xml
If you are using a version of VS 2010 that is not English, you will find the CollectionPlan.xml file under a directory named after your localized language name.
These two files allow us to use IntelliTrace without the IDE at all. The easiest way to launch an application with IntelliTrace is to use the launch command:
IntelliTrace.exe launch /collectionplan:CollectionPlan.xml /file:out.iTrace MyAwesomeExecutable.exe
When you use the launch command you will see something similar to this:
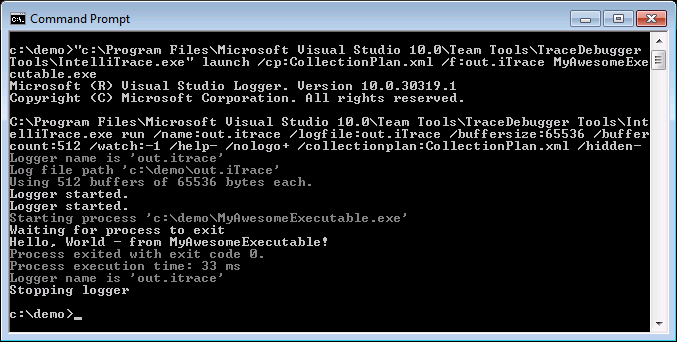
And you will have a newly created file out.iTrace. Let's take a look at the iTrace file:
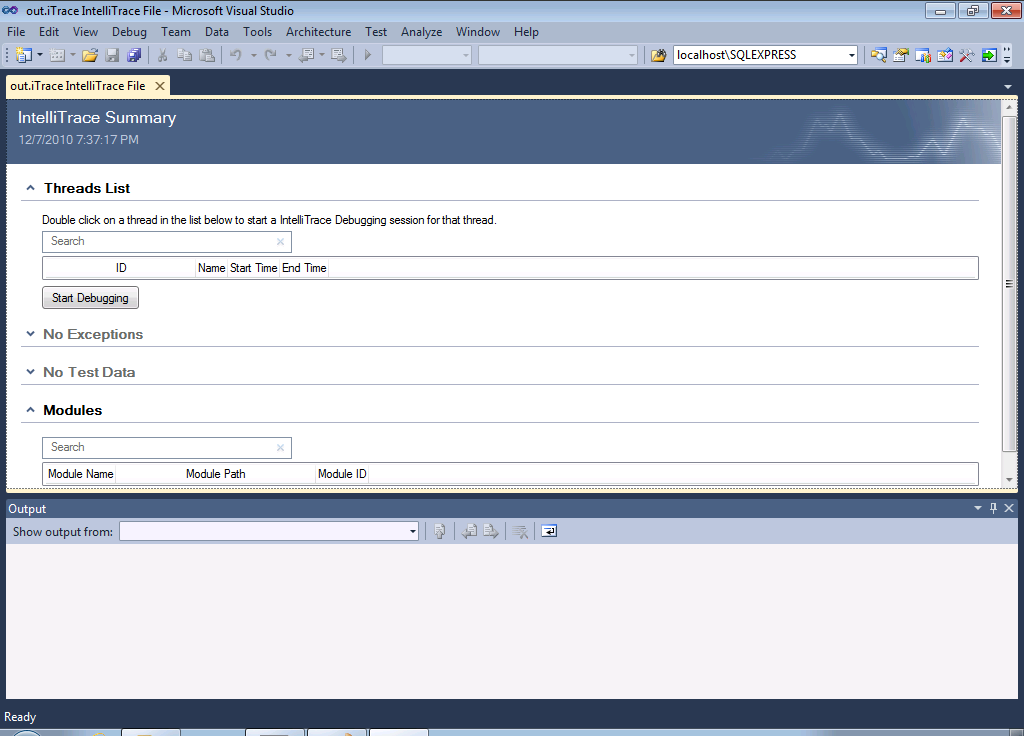
That's a bit strange - where is all of my IntelliTrace data?
The data you normally would expect to be in an iTrace file won't be present because the right options were not turned on for the collection session.
The default collection plan does not have any sort of collection enabled, and as such will not collect any data when used. Once we fix this, we can start collecting the data we need.
Getting Collection Options Set Up
The first step should be turning on the correct type of instrumentation. When modifying the collection plan, the first thing you should do is to turn on "DiagnosticEventInstrumentation" -- you can enable it by changing the following line (line 44 in the default Dev10 english collection plan)
<DiagnosticEventInstrumentation enabled="false">
change this to
<DiagnosticEventInstrumentation enabled="true">
This should always be turned on if you are going to be using IntelliTrace in the scenarios I'm going to describe, or you will be missing key information important for the log.
Note: For those of you curious as to what you will be missing, exception tracing and other features rely on having DiagnosticEventInstrumentation enabled, even if no events are turned on.
Now that DiagnosticEventInstrumentation is enabled, you have a multitude of collection options that are applicable.
To turn the dial up you can turn on TraceInstrumentation which will turn on tracing for function enters and exits, as well as parameter capturing. This is the setting that corresponds to “Methods and Parameters” in the IntelliTrace Tools->Options window.
Collect Your Data!
By turning on these types of Instrumentation, it is possible to now re-run our scenario (IntelliTrace.exe launch /cp:CollectionPlan.xml /f:out.iTrace MyAwesomeExecutable.exe) and we will get the data we expect, loadable by any Dev10 Ultimate installation.
Here Be Dragons!
The information below is not to be depended upon.
There are other ways to get IntelliTrace to collect information from a process. One way is to:
Start a logger with a specific name
Start a process with COR_PROFILER, COR_ENABLE_PROFILING, and VSLOGGERNAME/VSLOGGER_CPLAN set.
Stop the logger when you are done with your collection.
The way that the IntelliTrace profiler gets set up is the same as any other .NET profiler:
The environment variable COR_ENABLE_PROFILING has to be set to 0x1 or 1
The environment variable COR_PROFILER has to be set to the CLSID of a profiler that has been registered with the system.
For our scenario to work, the environment variable VSLOGGERNAME has to be set to the name of the logger, in lowercase-only letters, or the environment variable VSLOGGER_CPLAN has to point to a Collection Plan that is readable by the process being launched.
Since this is all quite tedious, we provide IntelliTrace Launch to make this whole process work. But if you are feeling on the wild side:
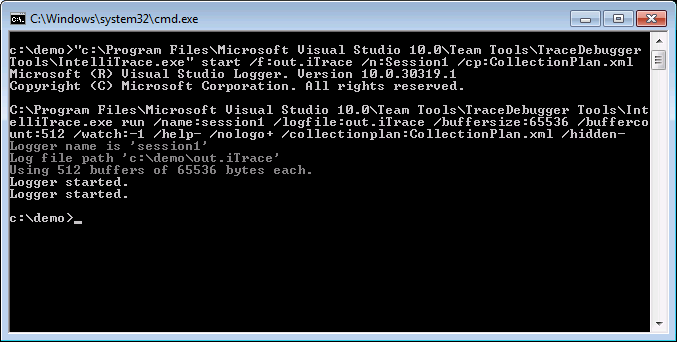
Start a logger – run “IntelliTrace.exe start /cp:PathToCollectionPlan.xml /f:iTraceLogFileLocation.iTrace /name:session1” – where:
PathToCollectionPlan.xml is the path to the collection plan
iTraceLogFileLocation.iTrace is where you want the IntelliTrace log file to be placed
session1 is a unique name for the logger.
You should get output similar to this:
Set COR_PROFILER, COR_ENABLE_PROFILING, and VSLOGGERNAME to the correct values for the environment. Then launch your application. If you are using the windows command prompt (cmd.exe):
- set COR_PROFILER={301EC75B-AD5A-459C-A4C4-911C878FA196}
- set COR_ENABLE_PROFILING=0x1
- set VSLOGGERNAME=session1
Note that the logger name is all lowercase.
When you are done (your process has exited,) the logger should have stopped on its’ own. If not, you can stop the logger using the following command: “IntelliTrace .exe stop /n:session1”
Finally you are done - you can now open your iTrace file and inspect the collected data.
If you do not want to start a logger manually, you may:
- Place the Collection Plan in a directory that is readable by the process you want to instrument
- Set the elements <LogFileDirectory> and <LogFileName> in the <StartupInfo> element to a valid location and name.
- Set COR_PROFILER, COR_ENABLE_PROFILING, and VSLOGGER_CPLAN to the correct values for the environment. Then launch your application. If you are using the windows command prompt (cmd.exe):
- set COR_PROFILER={301EC75B-AD5A-459C-A4C4-911C878FA196}
- set COR_ENABLE_PROFILING=0x1
- set VSLOGGER_CPLAN=c:\temp\collectionplan.xml
- Start your process.
- Once your process has exited you are done - you may now open your iTrace file an inspect the collected data.
I hope this has been a useful blog post for getting IntelliTrace collection working outside of the IDE. For questions or other queries please contact me using the "E-mail The Author" link on the right.