Get notified if OMS Log Analytics usage is higher than expected
Summary: Good morning everyone, Richard Rundle here, and today I want to talk about how you can get notified if your usage of Log Analytics goes above a predefined limit.
New Usage view
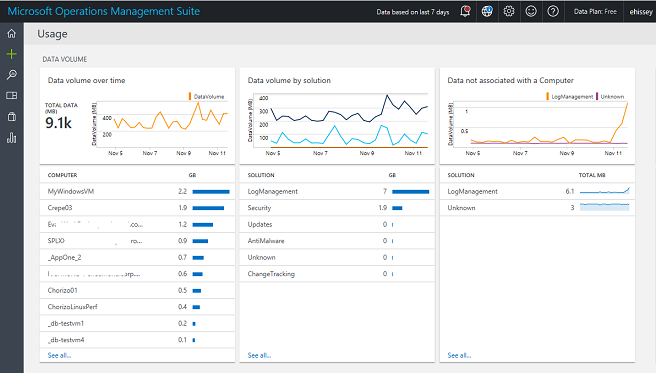
In mid-September, we updated the Usage view in Log Analytics so that you can get more insight into how much data is being sent to Log Analytics, and which solutions and computers are sending the most data. The usage data is calculated hourly and is available from search, which makes it easier to perform your own analysis and correlations.
The included views will give you information about:
- How much data is sent to Log Analytics and by which computers
- How much data is sent for each solution
- How much data isn’t associated with a computer
- Which computers are sending data and which computers haven’t recently sent data
- How many nodes are sending data for each of the OMS offers (Insight & Analytics, Automation & Control, and Security and Compliance)
- How long it takes for Log Analytics to make data searchable

These views provide a good starting point for understanding the data sent to Log Analytics, but what if you want to predict how much your usage might be?
Queries to show usage
The following query will tell me how many GB of data was sent in the last 24 hours:
Type=Usage QuantityUnit=MBytes IsBillable=true TimeGenerated > NOW-24HOURS | measure sum(div(Quantity,1024)) as DataGB by Type
What if I want to predict a day’s worth of data based on how much data was sent in the last 3 hours? The following sums the data sent in the last 3 hours, multiplies by 8 (to estimate usage for the day), and then divides by 1024 (to convert MB to GB).
Type=Usage QuantityUnit=MBytes IsBillable=true TimeGenerated > NOW-3HOURS | measure sum(div(mul(Quantity,8),1024)) as EstimatedGB by Type
These two queries let you know:
- My actual usage in the last 24 hours
- My estimated usage in the next 24 hours
Create an alert
Let’s assume that you expect to send 100 GB of data per day to Log Analytics and want to know if you have either sent more than 100 GB, or you expect to send more than 100 GB in a day.
Because we are going to create alerts, we can modify the above queries slightly to remove the TimeGenerated part of the query so that we can use the alert time window of the alert to control the time range. Next, we add a where command to return results only if we have more than 100 GB of data. Our modified queries look like this:
Type=Usage QuantityUnit=MBytes IsBillable=true | measure sum(div(Quantity,1024)) as DataGB by Type | where DataGB > 100
Type=Usage QuantityUnit=MBytes IsBillable=true | measure sum(div(mul(Quantity,8),1024)) as EstimatedGB by Type | where EstimatedGB > 100
To alert on a different data volume, change the 100 in the above queries to the number of GB you want to alert on.
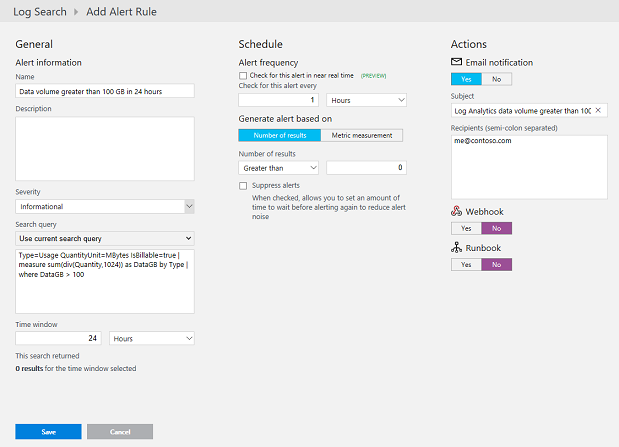
The following screenshot shows creating an alert for the first query, showing when I have more than 100 GB of data in 24 hours.
I’ve set the time window to be 24 hours, so I look at the last 24 hours of data, and I only check for the alert once per hour because the usage data only updates once per hour.
Note: I don’t use a metric measurement alert because I’m only calculating a single value. If I removed the where command and added an interval to my query so that it returned multiple values, I could use a metric alert.

I can use the same process to create an alert for the second query. For the second query, I set the time window to 3 hours and set the frequency to every 1 hour.
Now, if my data volume exceeds, or is expected to exceed, 100GB in 24 hours, I will get a notification. After I have the notification, I can investigate what caused the spike in usage and then make needed adjustments.
Detailed documentation about creating alerts is available in the Log Analytics documentation.
That is all I have for you today. I would like to hear any feedback you have. If you don’t already have your own Log Analytics workspace and want to try out the new usage view, you can sign up and access our demo workspace.
Please feel free to send me an e-mail at Richard.Rundle@microsoft.com with questions, comments, and suggestions.
Richard Rundle
Microsoft Operations Management Team