View your Agent Health in OMS
Summary: Learn how to view and monitor the health of your Windows and Linux agents in OMS.
Hi everyone, Nini here, and today I’m happy to announce that you are now able to view and monitor the health of your Windows and Linux agents in OMS. With agent heartbeat events, you can gain insights into the performance, availability and geo-location of your agents. If you have SCOM agents or direct agents connected to OMS, we will automatically start to generate and collect these agent heartbeat events. Best of all, they do not count towards your data volume.
First, go into Log Search and input Type=Heartbeat:
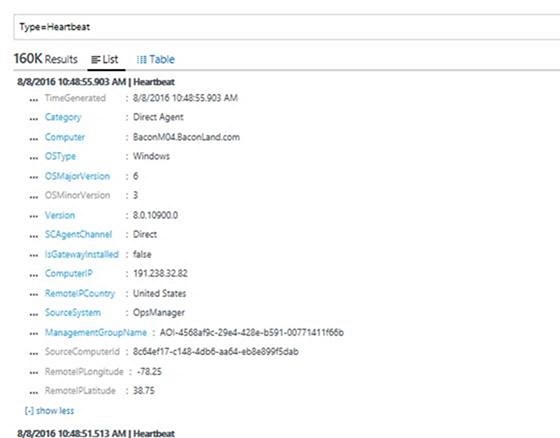
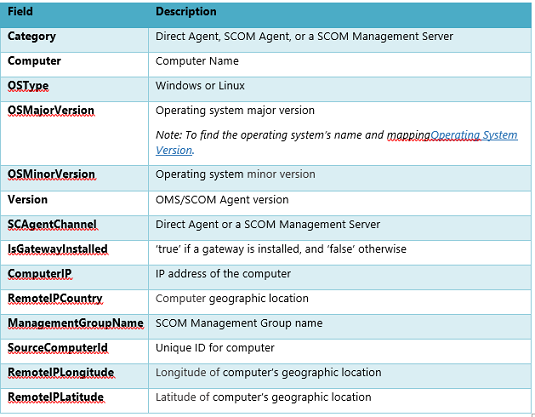
Now that you can see a list of all computers and servers with Windows and Linux agents installed, you can view the following fields:
Visualize Heartbeat Events
Using the View Designer, you can create an Agent Health solution to visualize these results. You can dive into key counters that you care about, such as the distribution of your agents and agent heartbeat overtime.
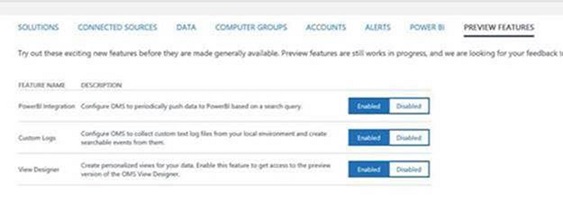
Be sure to enable the View Designer feature in “Preview Features” below, before following the next steps.
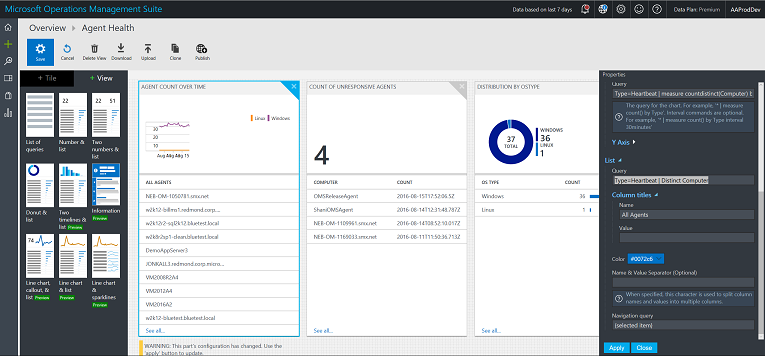
Next, open the View Designer, and populate each blade by using the following queries. In this example, I’m populating my Overview tile to see the total number of agents in my environment and the Agent Count over Time blade to view a trend of my number of agents over time.
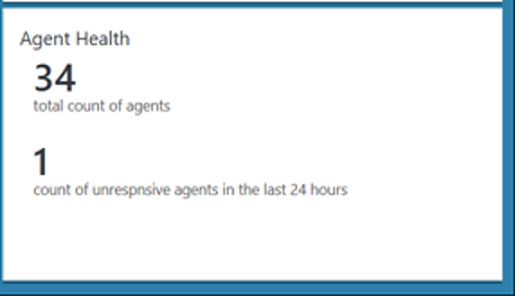
For the Overview tile, I use these queries to get the total number of agents, and a count of unresponsive agents in the last 24 hours:
Type=Heartbeat | distinct ComputerType=Heartbeat | measure max(TimeGenerated) as LastCall by Computer | where LastCall < NOW-24HOURS
In the Agent Count over Time blade, I use this query to get a trend of my number of agents over time:
Type=Heartbeat | measure countdistinct(Computer) by OSType
I use this query to get a list of all my computers in the “All Agents” list right below the trend:
Type=Heartbeat | Distinct Computer
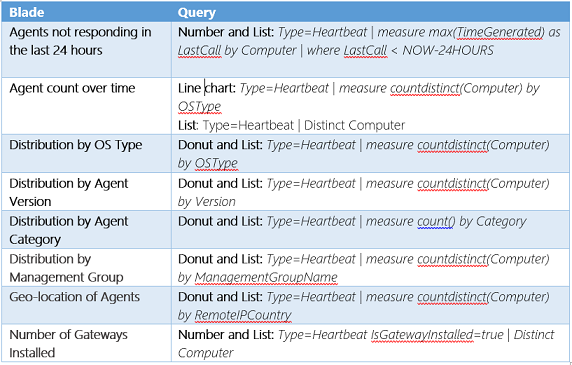
For the other blades in my Agent Health solution, I use the following queries:
Screenshots of the completed solution:
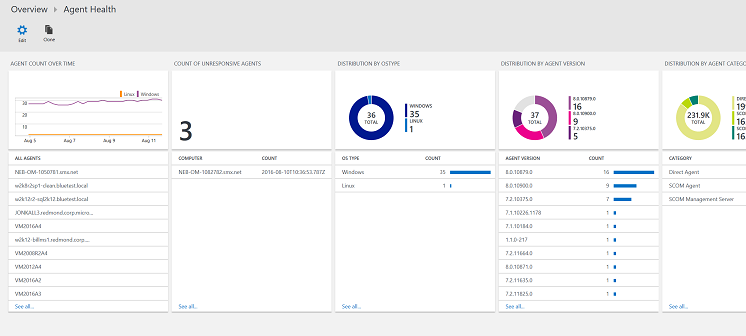
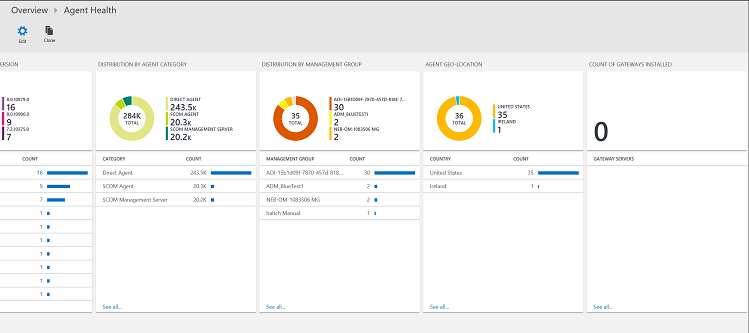
And voila! You’re can now get a quick sense of your agent health and set up from a glance at this dashboard.
Create Alerts to track Agent heartbeating
In addition to visualizing heartbeat events, you can also create alert rules so that you get notified when an agent has stopped heart beating for 24 hours or longer. You can simply do this by creating a log search and then selecting the Alert button to create and configure the alert.
Using this log search, Type=Heartbeat | measure max(TimeGenerated) as LastCall by Computer | where LastCall < NOW-24HOURS, here’s what the alert rule should look like:
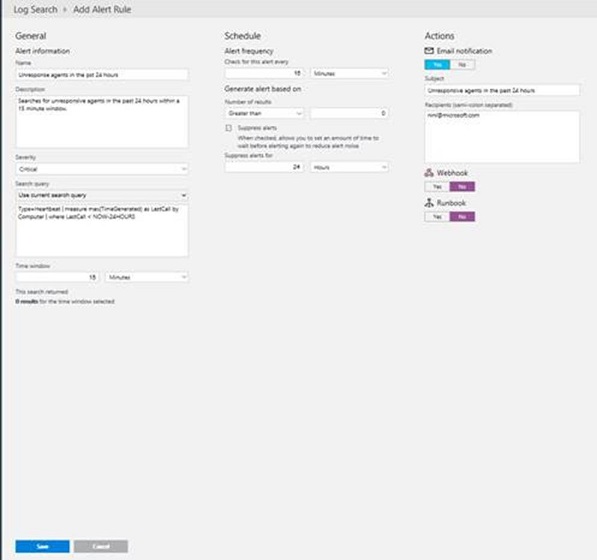
Click save, and your alert should start running immediately. To read more about how to set up alerts in Log Analytics, see Alerts in Log Analytics.
What's next?
We are currently working on an Agent Health OMS solution so that you can have a more in-depth and insightful visualization in OMS.
That’s all I have for you today. If you have any feedback or questions, please comment below.
Priscilla Nini Ikhena
Microsoft Operations Management Team
Comments
- Anonymous
August 18, 2016
Why is so much development effort going into OMS, which nobody uses, and almost none going into scom?- Anonymous
September 06, 2016
Hi Timothy,I don't agree with your comment. We need wide OMS functionality and OMS vs SCOM comparison should stop.If no effort goes into further developing OMS no one will ever use it an it won't have a chance.In Certain scenarios OMS is a better option then SCOM .It all depends on the situation(business).Don get me wrong, I'll take SCOM any time any place over competitors, but when it comes to cloud monitoring(SaaS to IaaS monitoring) OMS should be one of the basic tools to use.I agree that OMS misses certain basic tooling which is commodity in SCOM. Once again the twoo should not be directly compared.Did you look at the SCOM 2016 roadmap, it looks pretty decent and I believe that community had enough input 9as it should).
- Anonymous
- Anonymous
September 15, 2016
Am seeing incorrect values show up for "ComputerIP" field.Any thoughts? - Anonymous
September 30, 2016
What do you mean when you say "IsGatewayInstalled: true if a Gateway is installed"? Are you talking about SCOM Gateway or OMS Gateway?.I have installed an OMS Gateway (OMS Agent + OMS Gateway) and this property is marked as "false". Is this behaviour normal??? Apparently all is working well. One direct agent is reporting to OMS Gateway and OMS Gateway is reporting to OMS Portal. Moreover "Count of Gateways Installed" view in dashboard is 0.- Anonymous
October 06, 2016
IsGatewayInstalled value indicates whether the OMS Gateway is installed on that particular machine. Are you seeing the value of this as "false" for heartbeats from that machine ?
- Anonymous
- Anonymous
December 08, 2016
Hi, thank you for the really helpful article but unfortunately I cannot confirm it, the alert does not work. I shut down one of my Azure VM and it still listed with actual data under column timegenerated when I use: Type=Heartbeat Computer="ComputerName". I dont know what LastCall is but in my mind this is the wrong parameter to search for, because the call runs against the VM every few minutes, although its turned off. Is there somethink like LastAnswer or anything else? I adapt your query to test to Type=Heartbeat | measure max(TimeGenerated) as LastCall by Computer | where LastCall < NOW-1MINUTES and never get an alert of the turned off machine. (machine is successfully connected to OMS via MMA). Any hints? Thank you- Anonymous
December 08, 2016
I know LastCall = measure max(TimeGenerated).
- Anonymous
- Anonymous
February 10, 2017
The comment has been removed - Anonymous
April 27, 2017
Hello Priscilla,Thank you for adding agent health into OMS , this will help identify computers that are unresponsive. However I did have a question in regards to generating alerts. If a device becomes unresponsive an alert should trigger specifying that particular device. The current monitor will generate an alert for all devices if only a single computer becomes unresponsive. Is this the designed behavior, if so then an alert will need to be created per device unless i'm missing something.Kind Regards - Anonymous
May 12, 2017
Why is the default 24 hours? Wouldn't you want to know your server went down in like 5-15 minutes? Also, how do you change the default dashboard from 24HOURS to something reasonable? - Anonymous
May 25, 2017
Once a systems loss heartbeat how you restore Heartbeat collection? The system never went down or disconnected but OMS identified as if it was. When you check the Overview tile every day there are less and less agents accounted and running. (first day 88, 2nd day 87, 3rd day 84, 4th day 80 in the morning and 79 on the evening) is this normal behavior for OMS? and all server are up an running giving services to the clients.