Troubleshooting WCF Services during Runtime with WMI
Editor’s note: The following post was written by ASP.Net/IIS MVP Ido Flatow
Troubleshooting WCF Services during Runtime with WMI
One of the coolest features of WCF when it comes to troubleshooting is the WCF message logging and tracing feature. With message logging you can write all the messages your WCF service receives and returns to a log file. With tracing, you can log any trace message emitted by the WCF infrastructure, as well as traces emitted from your service code.
The issue with message logs and tracing is that you usually turn them off in production, or at the very least, reduce the amount of data they output, mainly to conserve disk space and reduce the latency involved in writing the logs to the disk. Usually this isn’t a problem, until you find yourself in the need to turn them back on, for example when you detect an issue with your service, and you need the log files to track the origin of the problem.
Unfortunately, changing the configuration of your service requires resetting it, which might result in loss of data, your service becoming unavailable for a couple of seconds, and possibly for the problem to be resolved on its own, if the reason for the strange behavior was due to a faulty state of the service.
There is however a way to change the logging configuration of the service during runtime, without needing to restart the service with the help of the Windows Management Instrumentation (WMI) environment.
In short, WMI provides you with a way to view information about running services in your network. You can view a service’s process information, service information, endpoint configuration, and even change some of the service’s configuration in runtime, without needing to restart the service.
Little has been written about the WMI support in WCF. The basics are documented on MSDN, and contain instructions on what you need to set in your configuration to make the WMI provider available. The MSDN article also provides a link to download the WMI Administrative Tools which you can use to manage services with WMI. However that tool requires some work on your end before getting you to the configuration you need to change, in addition to it requiring you to run IE as an administrator with backwards compatibility set to IE 9, which makes the entire process a bit tedious. Instead, I found it easier to use PowerShell to write six lines of script which do the job.
The following steps demonstrate how to create a WCF service with minimal message logging and tracing configuration, start it, test it, and then use PowerShell with WMI to change the logging configuration in runtime.
- Open Visual Studio 2012 and create a new project using the WCF Service Application template.
After the project is created, the service code is shown. Notice that in the GetDataUsingDataContract method, an exception is thrown when the composite parameter is null.
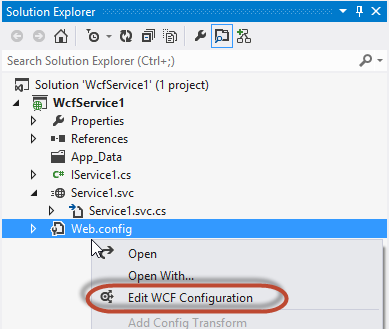
2. In Solution Explorer, right-click the Web.config file and then click Edit WCF Configuration.
3.In the Service Configuration Editor window, click Diagnostics, enable the WMI Provider, MessageLogging and Tracing.
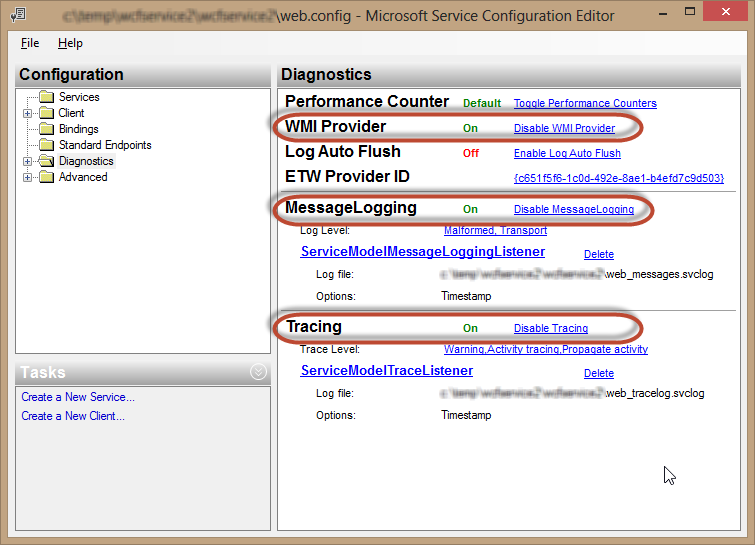
By default, enabling message logging will enable logging of all the message from the transport layer and any malformed message. Enabling tracing will log all activities and any trace message with severity Warning and up (Warning, Error, and Critical).
Although those settings are useful during development, in production we probably want to change them so we will get smaller log files with only the most relevant information.
4. Under MessageLogging, click the link next to Log Level, uncheck Transport Messages, and then click OK.
The above setting will only log malformed messages, which are messages that do not fit any of the service’s endpoints, and are therefore rejected by the service.
5. Under Tracing, click the link next to Trace Level, uncheck Activity Tracing, and then click OK.
The above setting will prevent every operation from being logged, unless those that output a trace message of warning and up. You can read more about the different types of trace messages on MSDN. https://msdn.microsoft.com/en-us/library/ms733025(v=vs.110).aspx
By default, message logging only logs the headers of a message. To also log the body of a message, we need to change the message logging configuration. Unfortunately, we cannot change that setting in runtime with WMI, so we will set it now.
6. In the configuration tree, expand Diagnostics, click Message Logging, and set the LogEntireMessage property to True.
7. Press Ctrl+S to save the changes, close the configuration editor window, and return to Visual Studio.
The trace listener we are using buffers the output and will only write to the log files when the buffer is full. Since this is a demonstration, we would like to see the output immediately, and therefore we need to change this behavior.
8. In Solution Explorer, open the Web.config file, locate the <system.diagnostics> section, and place the following xml before the </system.diagnostics> closing tag: <trace autoflush="true"/>
Now let us run the service, test it, and check the created log files.
9. In Solution Explorer, click Service1.svc, and then press Ctrl+F5 to start the WCF Test Client without debugging.
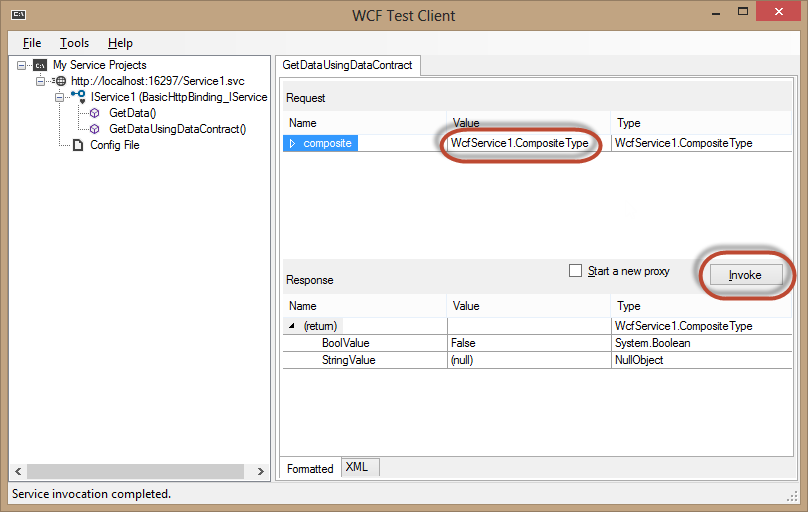
10. In the WCF Test Client window, double-click the GetDataUsingDataContract node, and then click Invoke. Repeat this step 2-3 times.
Note: If a Security Warning dialog appears, click OK.
11. In the Request area, open the drop-down next to the composite parameter, and set it to (null) .
12. Click Invoke and wait for the exception to show. Notice that the exception is general (“The server was unable to process the request due to an internal error.”) and does not provide any meaningful information about the true exception. Click Close to close the dialog.
Let us now check the content of the two log files. We should be able to see the traced exception, but the message wouldn’t have been logged.
13. Keep the WCF Test Client tool running and return to Visual Studio. Right-click the project and then click Open Folder in File Explorer.
14. n the File Explorer window, double-click the web_tracelog.svclog file. The file will open in the Service Trace Viewer tool.
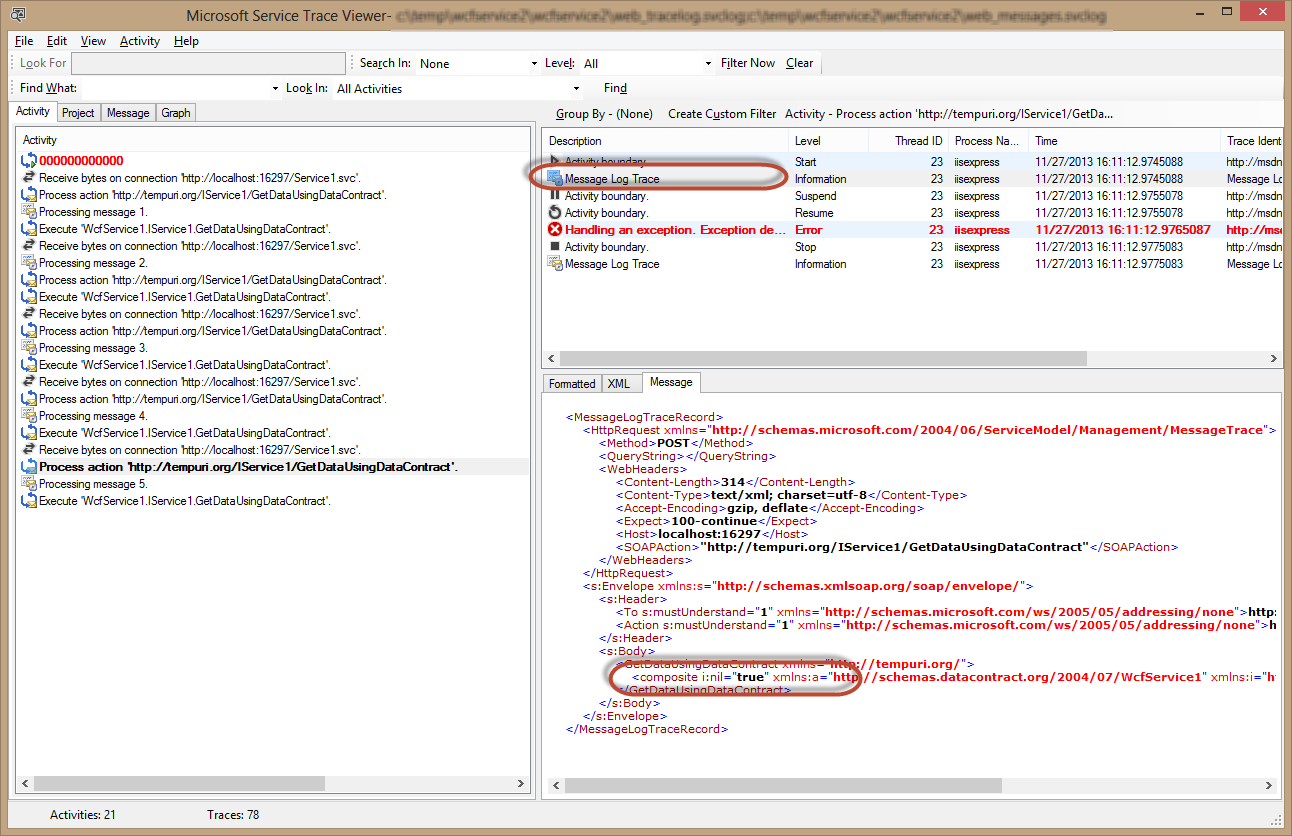
15. n the Service Trace Viewer tool, click the 000000000000 activity in red, and then click the row starting with “Handling an exception”. In the Formatted tab, scroll down to view the exception information.
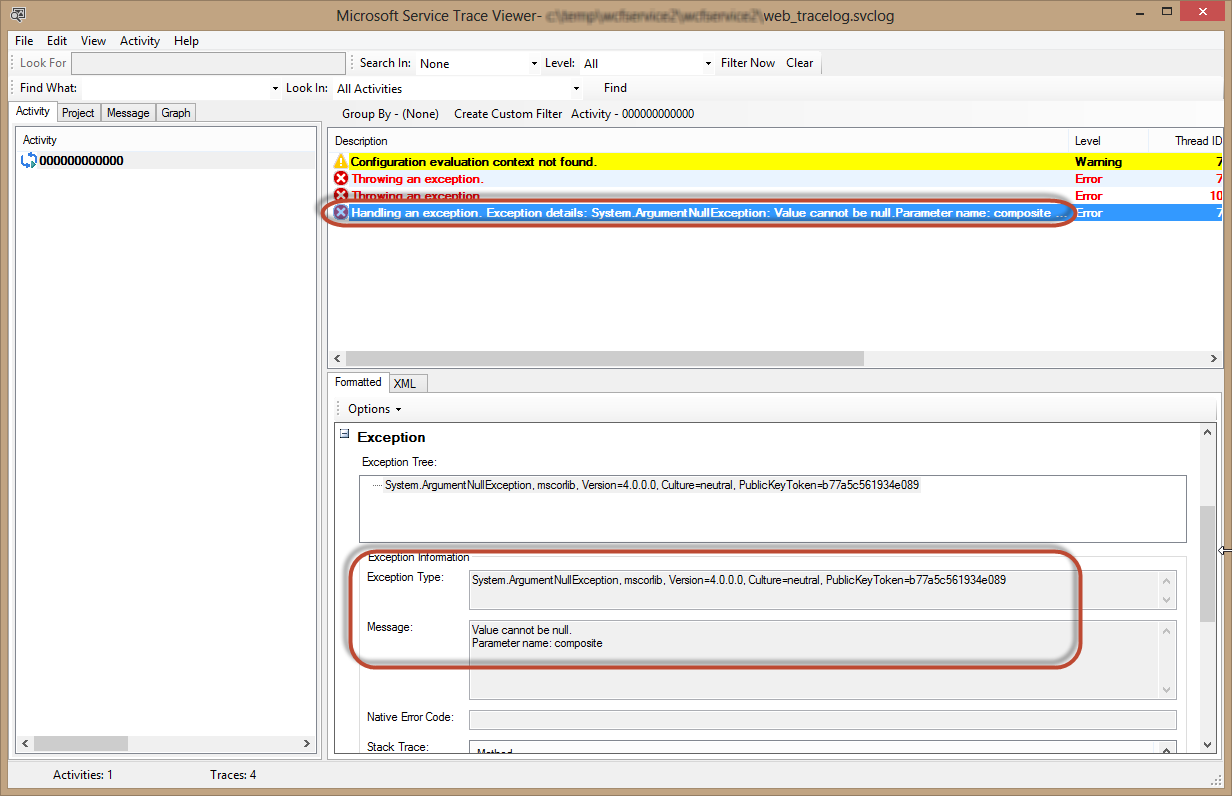
As you can see in the above screenshot, the trace file contains the entire exception information, including the message, and the stack trace.
Note: The configuration evaluation warning message which appears first on the list means that the service we are hosting does not have any specific configuration, and therefore is using a set of default endpoints. The two exceptions that follow are ones thrown by WCF after receiving two requests that did not match any endpoint. Those requests originated from the WCF Test Client tool when it attempted to locate the service’s metadata.
Next, we want to verify no message was logged for the above argument exception.
16. Return to the File Explorer window, select the web_messages.svclog file, and drag it to the Service Trace Viewer tool. Drop the file anywhere in the tool.
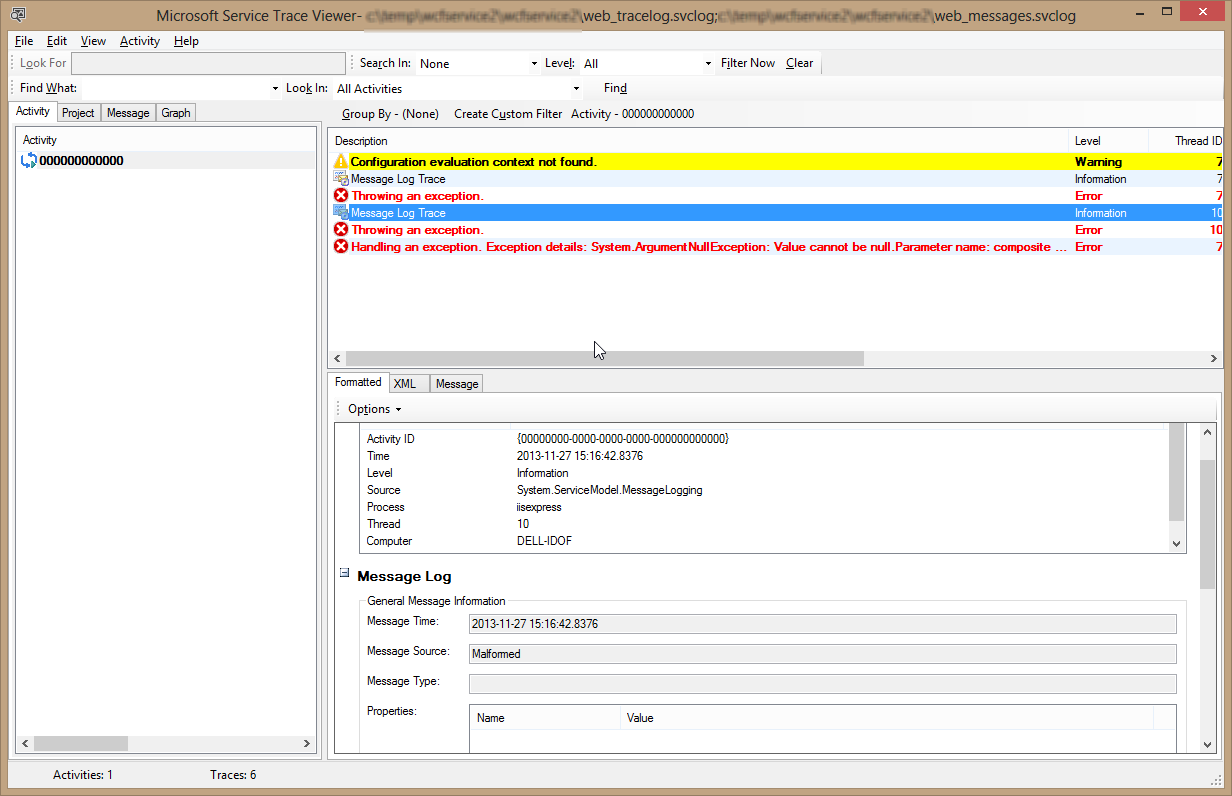
There are now two new rows for the malformed messages sent by the WCF Test Client metadata fetching. There is no logged message for the faulted service operation.
Imagine this is the state you now have in your production environment. You have a trace file that shows the service is experiencing problems, but you only see the exception. To properly debug such issues we need more information about the request itself, and any other information which might have been traced while processing the request.
To get all that information, we need to turn on activity tracing and include messages from the transport level in our logs.
If we open the Web.config file and change it manually, this would cause the Web application to restart, as discussed before. So instead, we will use WMI to change the configuration settings in runtime.
17. Keep the Service Trace Viewer tool open, and open a PowerShell window as an Administrator.
18. To get the WMI object for the service, type the following commands in the PowerShell window and press Enter: $wmiService = Get-WmiObject Service -filter "Name='Service1'" -Namespace "root\servicemodel" -ComputerName localhost $processId = $wmiService.ProcessId $wmiAppDomain = Get-WmiObject AppDomainInfo -filter "ProcessId=$processId" -Namespace "root\servicemodel" -ComputerName localhost
Note: The above script assumes the name of the service is ‘Service1’. If you have changed the name of the service class, change the script and run it again. If you want to change the configuration of a remote service, replace the localhost value in the ComputeName parameter with your server name.
19. To turn on transport layer message logging, type the following command and press Enter: $wmiAppDomain.LogMessagesAtTransportLevel = $true
20. To turn on activity tracing, type the following command and press Enter: $wmiAppDomain.TraceLevel = "Warning, ActivityTracing"
21. Lastly, to save the changes you made to the service configuration, type the following command and press Enter: $wmiAppDomain.Put()
22. Switch back to the WCF Test Client. In the Request area, open the drop-down next to the composite parameter, and set it to a new CompositeType object. Click Invoke 2-3 times to generate several successful calls to the service.
23. In the Request area, open the drop-down next to the composite parameter, and set it to (null) .
24. Click Invoke and wait for the exception to show. Click Close to close the dialog.
25. Switch back to the Service Trace Viewer tool and press F5 to refresh the activities list.
You will notice that now there is a separate set of logs for each request handled by the service. You can read more on how to use the Service Trace Viewer tool to view traces and troubleshoot WCF services on MSDN. https://msdn.microsoft.com/en-us/library/aa751795(v=vs.110).aspx
26. From the activity list, select the last row in red that starts with “Process action”.
You will notice that now you can see the request message, the exception thrown in the service operation, and the response message, all in the same place. In addition, the set of traces is shown for each activity separately, making it easy to identify a specific request and its related traces.
27. On the right pane, select the first “Message Log Trace” row, click the Message tab, and observe the body of the message.
Now that we have the logged messages, we can select the request message and try to figure out the cause of the exception. As you can see, the composite parameter is empty (nil).
If this was a production environment, you would probably want to restore the message logging and tracing to its original settings at this point. To do this, return to the PowerShell window, and re-run the command from before with their previous values:
$wmiAppDomain.LogMessagesAtTransportLevel = $false
$wmiAppDomain.TraceLevel = "Warning"
$wmiAppDomain.Put()
Before we conclude, now that your service is manageable through WMI, you can use other commands to get information about the service and its components. For example, the following command will return the service endpoints’ information:
Get-WmiObject Endpoint -filter "ProcessId=$processId" -Namespace "root\servicemodel" -ComputerName localhost
About the author

Ido is a senior architect and trainer at SELA Group, and an expert on Windows Azure and Web technologies, such as WCF, ASP.NET, IIS, and Silverlight. Ido is a Microsoft ASP.NET/IIS MVP, a Microsoft certified trainer (MCT), and the co–author of Microsoft's official courses for WCF 4 (10263A) and Building Web Services for Windows Azure (20487B). Ido is also the co-author of the book Pro .NET Performance, and the manager of the Israeli Web Developers User Group.
You can follow Ido's work on his blog at https://blogs.microsoft.co.il/blogs/idof and on Twitter: @IdoFlatow
About MVP Monday
The MVP Monday Series is created by Melissa Travers. In this series we work to provide readers with a guest post from an MVP every Monday. Melissa is a Community Program Manager, formerly known as MVP Lead, for Messaging and Collaboration (Exchange, Lync, Office 365 and SharePoint) and Microsoft Dynamics in the US. She began her career at Microsoft as an Exchange Support Engineer and has been working with the technical community in some capacity for almost a decade. In her spare time she enjoys going to the gym, shopping for handbags, watching period and fantasy dramas, and spending time with her children and miniature Dachshund. Melissa lives in North Carolina and works out of the Microsoft Charlotte office.