Note
Access to this page requires authorization. You can try signing in or changing directories.
Access to this page requires authorization. You can try changing directories.
Update: Ryan Andorfer has posted some good information over at the Building Clouds blog on his experience with continuous running SMA monitors, some issues encountered, and how he has mitigated these issues. Check it out here - Automation - MVP Spotloght Series - SMA: DFS Share Creation Request Walkthrough In Depth .
Introduction: One of the more popular use cases I’ve encountered with System Center Orchestrator is the scenario where in a Monitor Alert (SCOM) activity is used to trigger automation as the result of a detected alert. A simplified yet practical example as seen in System Center Orchestrator may look like the following:
Parent Runbook monitors for alert. Once the alert is detected a child or component Runbook is invoked to perform some automated inspection / remediation. In the case of this example, the received alert indicates that the Print Spooler service has stopped on at least one monitored computer.
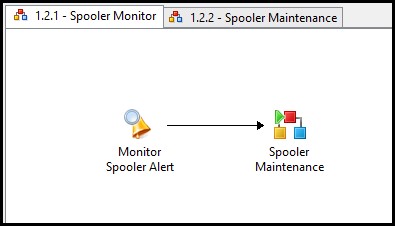
During the component or child Runbook the SCOM alert may be updated (resolution stated set to acknowledged), the print spooler examined, and an attempt made to start said service. Finally if the service cannot be started, an incident is raised in System Center Service Manager.

Again, this is an overly simplified example but will serve well conceptually for this post.
How then can we replicate this type of monitoring in System Center Orchestrator: Service Management Automation (SMA)?
You may have noticed that there is no native SMA activity for SCOM monitoring. Further more, because we need to write SMA automations using PowerShell workflows, the moitoring solution may not be obvious (at least is was not for myself).
During this blog posting I will be detailing how to replicate the behavior of the above Orchestrator Runbooks with Orchestrator SMA.
SMA and Monitoring:
Simply said, at this point, in order to achieve this type of monitoring in Orchestrator SMA we need to craft the monitor using an SMA Runbook / PowerShell workflow. As it turns out, the solution I will be showing here (one of potentially many) was very simple to create. What I have done is to use a simple Do-While loop to craft the Monitor. The following can be used as a template for a SCORCH SMA Monitoring Runbook.
| 001002003004005006007008009010011012013014015016 | workflow Alert_Template{ While ($True) { #Monitoring Interval Start-Sleep -s 10 $monitorResults = InlineScript { #Monitor Logic Here } If ($monitorResults) { #React to Monitor Here } }} |
Take note of the following items:
- Line 003 – here I am setting while ($True) which will create an infinite while loop, which is core to a monitoring activity
- Line 006 – Defines the monitoring interval (how often to check for the monitored condition)
- Line 008 – Here I am using an inline script which will hold all monitoring logic. This could be any monitoring condition such as checking SCOM for new alerts, checking a service, or checking a mailbox for a new email. I am placing the results of the monitor into a variable $monitorResults. To note, you may not need the inlinescript depending on the logic placed here.
- Line 012 – If the $monitorResults variable has been populated or in other words the monitoring check resulted in positive detection, we can react here. This reaction may be to execute a second Runbook such as in my initial Orchestrator Spooler example.
Practical Example:
In the following full featured example I am using a Runbook to monitor SCOM for any new alerts that match specific criteria. The Runbook completes the following:
- Checks SCOM every 30 seconds for a new alert with a MonitorObjectName of Spooler
- If an alert is detected, invokes a second Runbook that sets the alert state to 249 (Acknowledged)
- Then invokes a third Runbbok to check the state of the service. If the service is stopped, attempts to start it, and then 'returns' the service state to the parent Runbook
- If the service could not be started, a Runbook is invoked to create a Service Manager Incident.
- If the service could be started, or was running after first check, a Runbook is invoked to set the Resolution stat of the alert to ‘Resolved’.
This solution includes many different Runbooks to perform all of these automated checks and remediation's, I will only be detailing the monitor itself. A copy of the complete solution can be found here for further investigation - TechNet Gallery .
| 001002003004005006007008009010011012013014015016017018019020021022023024025026027028029030031032033034035036037038039040 | workflow B101_Monitor-Spooler{ $con = Get-AutomationConnection -Name 'SCOM_Connection' $securepassword = ConvertTo-SecureString -AsPlainText -String $con.Password -Force $cred = New-Object -TypeName System.Management.Automation.PSCredential -ArgumentList $con.Username, $securepassword $scommp = Get-AutomationVariable -Name 'SCOM MP Path' While ($True) { Start-Sleep -s 30 $alerts = InlineScript { Import-module $Using:scommp Get-SCOMManagementServer -Name $Using:con.ComputerName Get-SCOMAlert -ResolutionState 0 | where {$_.MonitoringObjectName -contains 'Spooler'} } -PSComputerName $con.ComputerName -PSCredential $cred If ($alerts) { Foreach -Parallel ($alert in $alerts) { B102_Update-Alert -alertId $alert.Id -resState 249 $checkResults = B103_Check-Service -netBiosComputerName $alert.NetBiosComputerName If ($checkResults -eq "Running") { B102_Update-Alert -alertId $alert.Id -resState 255 } else { B104_Submit-Incident } } } }} |
Items to Note:
- 003 – 005: Establish SCOM Connection Information (see SMA provided SCOM sample for more info)
- 006: Variable holding the location of the SCOM PS Module
- 008: Establishing an infinite loop
- 012 – 018: This is the Monitor. The SCOM PS Module is being imported and the Get-SCOMAlert CMDLET used to gather alerts. Notice that
- 020 – 038: This is the reaction to a positive Monitor (individual details below)
- 022: Notice the Foreach –Parallel. When multiple alerts are detected this will allow all of them to be process in parallel
- 023: Child Runbook call to set the alert state to acknowledged
- 026: Child Runbook call to check service and attempt start. Notice here that the results of the child Runbook are stored in variable $checResults.
- 028 – 031: If service can be started call to child Runbook to resolve the alert
- 033 – 036: if service cannot be started call to child Runbook to submit incident.
Wrap Up: As seen here, while we do not have a native SCOM monitoring activity in SMA, crafting our own is not difficult and provides some neat flexibility. A little bit of PowerShell, some fundamental automation logic, and a bit of SMA / PowerShell workflow specific concepts and I’ve almost identically replicated what was being performed with SCOM monitoring in my original SCORCH Rubook solution.
Happy Automating - neilp