New Telemetry Dashboard article and video on custom reporting on TechNet
Find out how custom reports in Telemetry Dashboard help you create a customized view of Office telemetry data.
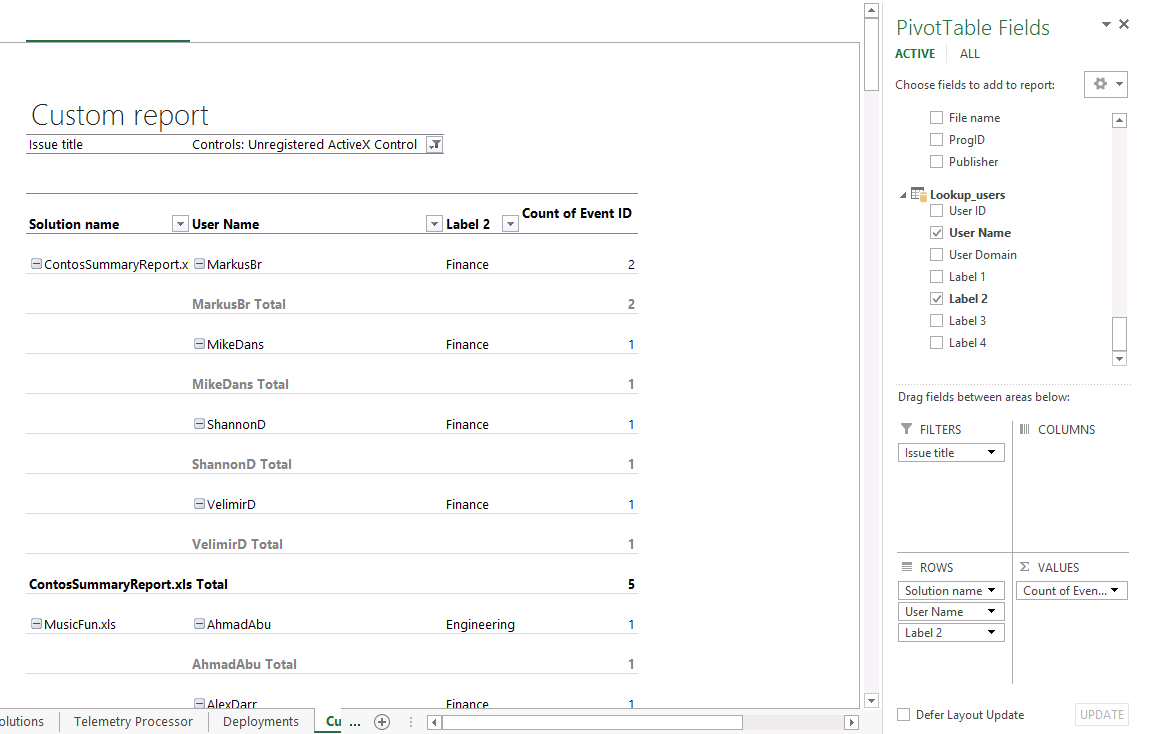
If you’ve used Telemetry Dashboard, you may have seen the Custom Report worksheet but didn’t quite know what it’s used for. After all, there’s already a ton of data in the dashboard—what more could you ask for? Well, if you’ve ever found yourself switching between worksheets to view data that’s related, you’ll want to check out our new resources on custom reporting. A custom report is essentially a PivotTable report where you can pull various telemetry data into a single worksheet. If you set labels (also called tags) when you deployed the agents, then the custom reports are even more powerful, because you can filter or sort data for subsets of users, like in the report shown below. This is a summary of unregistered ActiveX controls, and you can see the user name and business group for each of these solutions.
Check out the resources below to learn more about custom reports in Telemetry Dashboard:
Watch a video on custom reporting
Read a how-to article on custom reporting
While you’re getting acquainted with custom reports, we’re working on another blog post on advanced custom reporting. This will be useful for customers who want to create multiple custom reports outside of Telemetry Dashboard. This requires a number of steps for connecting to the database, creating a new table for issue-related data, and creating relationships between tables. So stay tuned for a more in-depth look at custom reporting here on the Office IT Pro blog.
If you find a great use for custom reports, let us know! We’re always eager to hear how our customers use our tools.
Jill