Note
Access to this page requires authorization. You can try signing in or changing directories.
Access to this page requires authorization. You can try changing directories.
Introduction
If you observe either of the following events under the system logs in Event Viewer, then this article is meant for you.
A process serving application pool '%1' suffered a fatal communication error with the Windows Process Activation Service. The process id was '%2'. The data field contains the error number.
A process serving application pool '%1' terminated unexpectedly. The process id was '%2'. The process exit code was '%3'.
This is a clear indication of an application pool crash issue wherein something went wrong within the application and the application pool had to be terminated. Once the application pool is terminated, its corresponding w3wp process is also terminated. Hence, if you have saved any cache/sesson based information within the w3wp process, it gets completely wiped out.
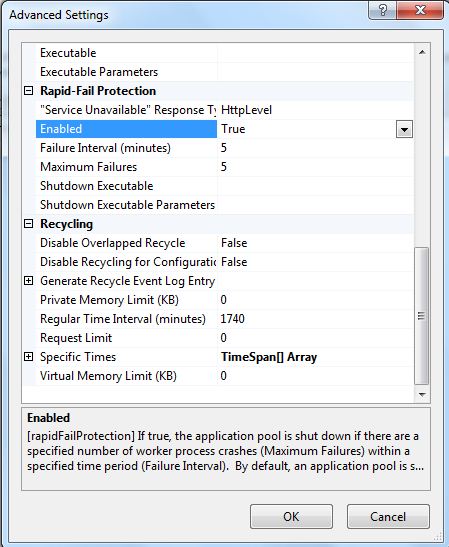
Ideally, when an application pool crashes, in order to honor the incoming requests, a new w3wp process gets spawned up automatically. However, if the application pool crashes more than 5 times within a period of 5 minutes, then the application pool goes into a stopped state. You will have to restart the application pool manually to get it up and running. You will observe the following event under system logs in Event Viewer if something similar happens.
Application pool '%1' is being automatically disabled due to a series of failures in the process(es) serving that application pool.
You can modify this setting under "Rapid Fail Protection" section present under Advanced settings of the respective application pool. It is "Enabled" by Default.
Capture Dumps
Now that we know that our application pool has crashed, the next step is to determine why exactly it crashed. In order to determine this, we will have to capture a dump of the w3wp process just before it terminates. There are multiple ways to do this. You can set up WER, procdump and Debug Diag to capture a crash dump. In this article, I will discuss only the Debug Diag way of capturing data.
Debug Diag
This is by far the easiest and the most sophisticated tool to capture a crash dump of an application pool. This is how we set it up. You can download it from here.
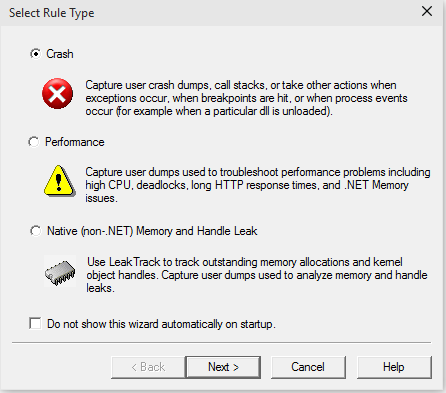
Launch debug diag and select “crash” rule.
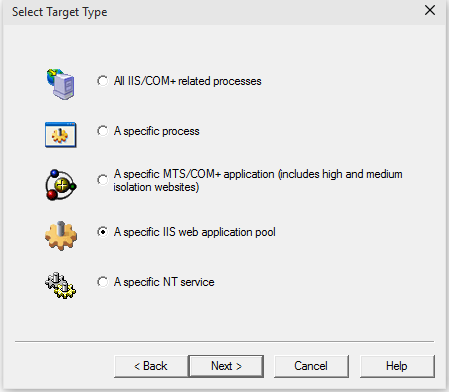
Select “A specific IIS web application pool”
Select the specific application pool which is crashing.
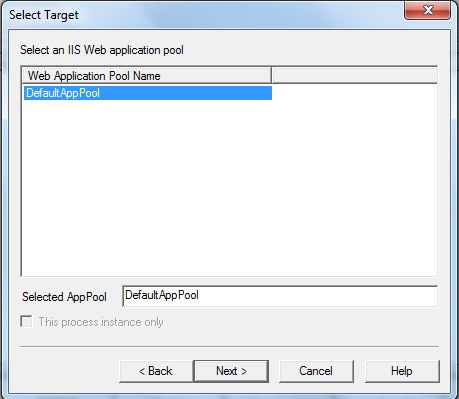
You might also receive a pop up indicating that the IIS management compatibility feature is not installed and that the application pools will not be listed. Not to worry ! Just click on OK and type in the application name manually in the above window.
Select “Breakpoint”
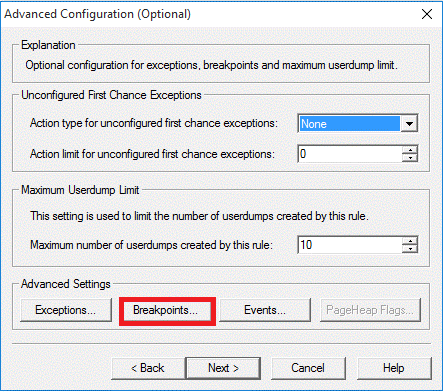
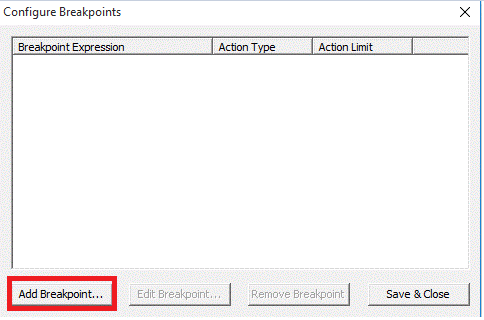
Click on “Add breakpoint”
Click on “Ntdll!ZwTerminateProcess” under Breakpoint such that it is selected as the Breakpoint Expression. Change Action Type to “Full userdump” and set Action Limit to 10 and click on OK.
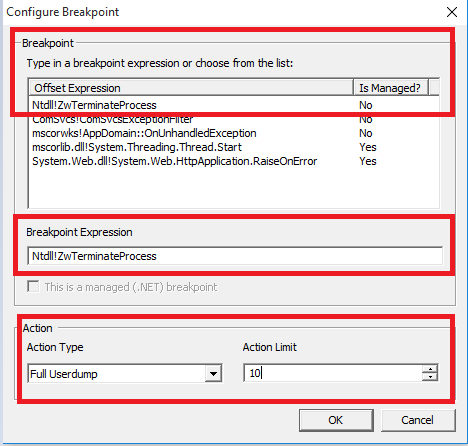
Action Type indicates the type of dump that would be captured. A mini user dump will not provide complete information of the issue as it captures very minimal data of the w3wp process.
Action Limit indicates the number of dumps that this rule will capture.
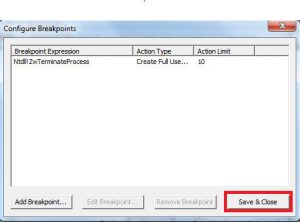
Click on Save and close
Click on Next to activate the breakpoint
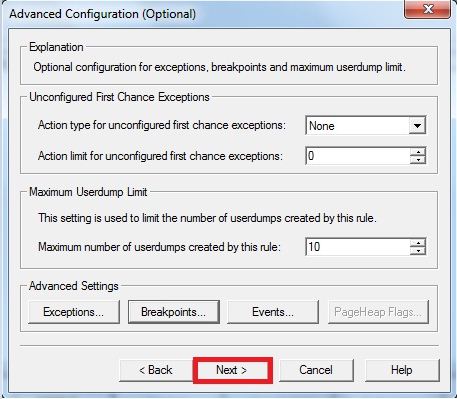
Click on "Next"

In the above section, you can change the path where the dumps will be stored. The size of each dump file will be the same as that consumed by w3wp process in the memory. So, keeping that in mind, place the dumps in a drive that has enough free disk space.
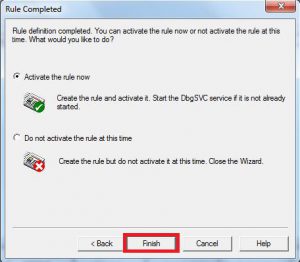
Click on "Finish" to activate the Rule.
You will now see that the crash rule is in active state and the "Userdump Count" is 0. As soon as the issue occurs, the dump count will increase and a corresponding dump file will be generated.
PS: A normal recycle of the application pool will also trigger a dump. This is because when the application pool recycles, its corresponding w3wp process's PID changes and hence a dump gets generated. This is a false positive dump and will not help in the analysis of the application pool crash issue. So whenever you see an increment in the userdump count, check the event logs to see if the above mentioned crash events have occurred. If yes, then the dump that has been captured is correct.
Dump Analysis
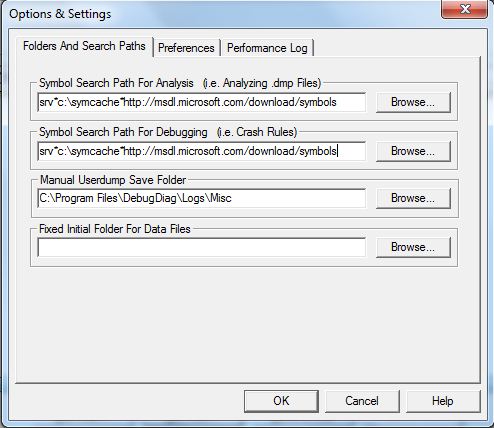
Once the dump is captured, you can use the Debug Diag Analysis executable to analyse the captured crash dump. Just a "double click" on the dump will also work. Make sure you have the symbol path set right. To check this, select Tools --> Options and settings and make sure your "Symbol Search Path for Analysis" and "Symbol Search path for Debugging" are set to "srv*c:\symcache*https://msdl.microsoft.com/download/symbols".
Once the report is generated, you can open it in IE and understand the call stack of the thread that triggered the Breakpoint Expression. Read the call stack from bottom to top and figure out which method or component triggered the application pool to crash
Hope this helps :)
Comments
- Anonymous
November 09, 2016
thanks - Anonymous
July 31, 2017
Yes, this is really helpful - Anonymous
October 12, 2017
Thank you for this! We had an app pool crashing and it was due to a memory leak. Without this article I wouldn't have been able to track down which plugin was causing it.- Anonymous
February 11, 2018
You're welcome ! Glad it helped :)
- Anonymous
- Anonymous
June 27, 2018
Thanks for the information, it's very helpful. I can get DebugDiag to run as you explained, but Windows now throws this error information message in the System event log "A worker process with pid '4792' that serves application pool 'DataApi' has been determined to be unhealthy (see previous event log message), but because a debugger is attached to it, the Windows Process Activation Service will ignore the error."Any idea how to get around this?- Anonymous
July 03, 2018
Could you please share the error message that you receive in the event viewer just before or after this error ? I strongly suspect it to be an application pool hang issue but I can confirm once the exact error is known.
- Anonymous