Investigate High CPU for a Process: Part 1
Hello World! This is my 1st ever blog and I hope there is more to come after this. So my name is Leo Leong and I am one of among many in the field that goes out to attend situations when there is a dev issue. In many ways, I've always thought that we are like the "mighty mouse" in our field, "Here I come to save the day...". Well, it's not always like that but that's how I'd like to think of us :)
Alright, enough said and let's get back on track with the real deal. So the real world has proven to be a much more complicated arena but for simplicity sake I've created an academic sample here to illustrate what we are going to accomplish. And that is to find out what a process is doing when you see it is taking up much of your system's CPU. Imagine the following scenario:
I have develop a web site and whenever I browse to a page, it pegs my machine's CPU. What is it doing?
Basically, there are quite a few tools that come to mind but I will introduce 2 of them in this 1st part because they are platform (x86/x64) and .NET version agnostic. But more importantly, we can't use Visual Studio!
The first tool is called Process Explorer. You can find more details and download here. It is a very GUI driven tool and does a good job in terms of presenting what you might be interested within any given processes. Here's what it looks like when I looked at the stack trace for the worker process's (w3wp.exe) threads and specifically the thread with the highest CPU:
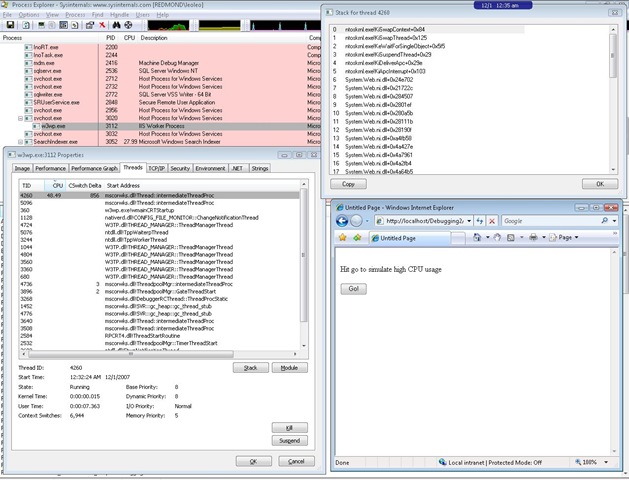
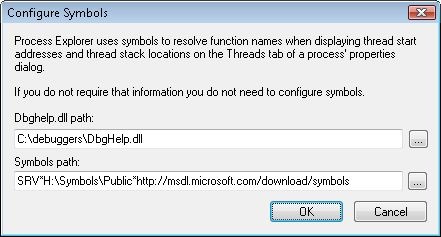
Note, you will have to configure the symbols to be able to see the function names shown in the above screen shot. To do that simply go to Options | Configure Symbols... and put in the Symbols path such as the following:
I've made a number of assumptions here and that is you understand what a process, thread and stack means. Also, I'm assuming you are aware of what managed and native code is. But regardless, the essence of this tools is that it gives you a stack trace of any threads within a process which makes it a very powerful tool.
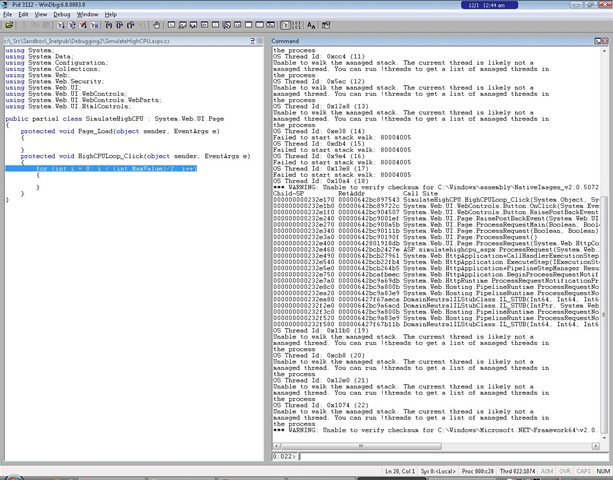
So, we are half way through this problem and discovered what the stack looked like for the thread in question causing high CPU. Because this is a .NET application (more accurately ASP.NET), we need something more to dig in further. Hence, we bring out the next tool called Windbg. More details and download can be found here. This is pretty much the de facto tool used within Microsoft to debug any issues and you'll hear this a lot from us. Now to explain all the details of what to do when debugging a managed application is yet again outside the scope but here's the command you can use to get the stack traces for all managed threads:
~*e!clrstack
When you attach the debugger (Windbg) to the worker process and issue the above command, this is roughly what it will look like:
The command used above is part of the manage extension called SOS and you will need to load it in the debugger before you can debug any manage application. In case you are not already familiar with, try the following to load SOS:
.loadby sos mscorwks
So, what can we conclude so far? Well, save to say the function HighCPULoop_Click is the root cause of the problem here. A for loop that goes from 0 to int.MaxValue/2 which is about 1 billion, is a lot to loop through!! Once again, this is only an academic sample that I've wiped up in my spare time to represent a high CPU scenario. There are lots of reason why a good for loop can go bad :)