Identifying Cell by Cell Computation Mode in MDX queries
Some weeks ago I was asked to help with a performance issue with some MDX Queries.
I was shown what the customer wanted to achieve, they needed to calculate some metrics including sampling errors using the method of “Conglomerados Últimos” (This can be translated to “Conglomerates Last” Method), this method was created by a Spanish Researcher and publish in a Spain Publication to calculate sampling errors a posteriori when the sample is stratified. This method is described in Spanish (Sorry I don’t an English version of this document) here https://dialnet.unirioja.es/descarga/articulo/250808.pdf
Just trying to understand the method and formulas was hard, but the customer had already an elegant solution using an MDX Script and the SCOPE statement. So I focused on the performance issue instead of trying to understand the formulas.
After a couple of hours I found out that the formula was using cell by cell calculation instead of block calculation, then found the operator in fault (the “^” operator) and after a small change (multiply the measure by itself) the query improved from around 30 seconds to 1 second.
You can find some details about the operators that support block computation in “Identifying and Resolving MDX Query Performance Bottlenecks in SQL Server 2005 Analysis Services” found in https://www.microsoft.com/en-us/download/details.aspx?id=661, you can also find some guidelines to improve query performance in https://msdn.microsoft.com/en-us/library/bb934106.aspx
What I want to focus in this blog is how you can detect that the issue is Cell by Cell Calculations.
We have two main tools to troubleshoot this kind of problems, SQL Server Profiler and Performance Monitor, the recommended order is to identify that the problem is Formula Engine using the profiler and then use the Performance monitor to confirm that the query is using Cell By Cell Calculation instead of block calculation (or computation).
Here is the recommended methodology, this is not new, but I haven’t found a good reference that goes through this steps.
Step 1. Identify if bottleneck is Formula engine
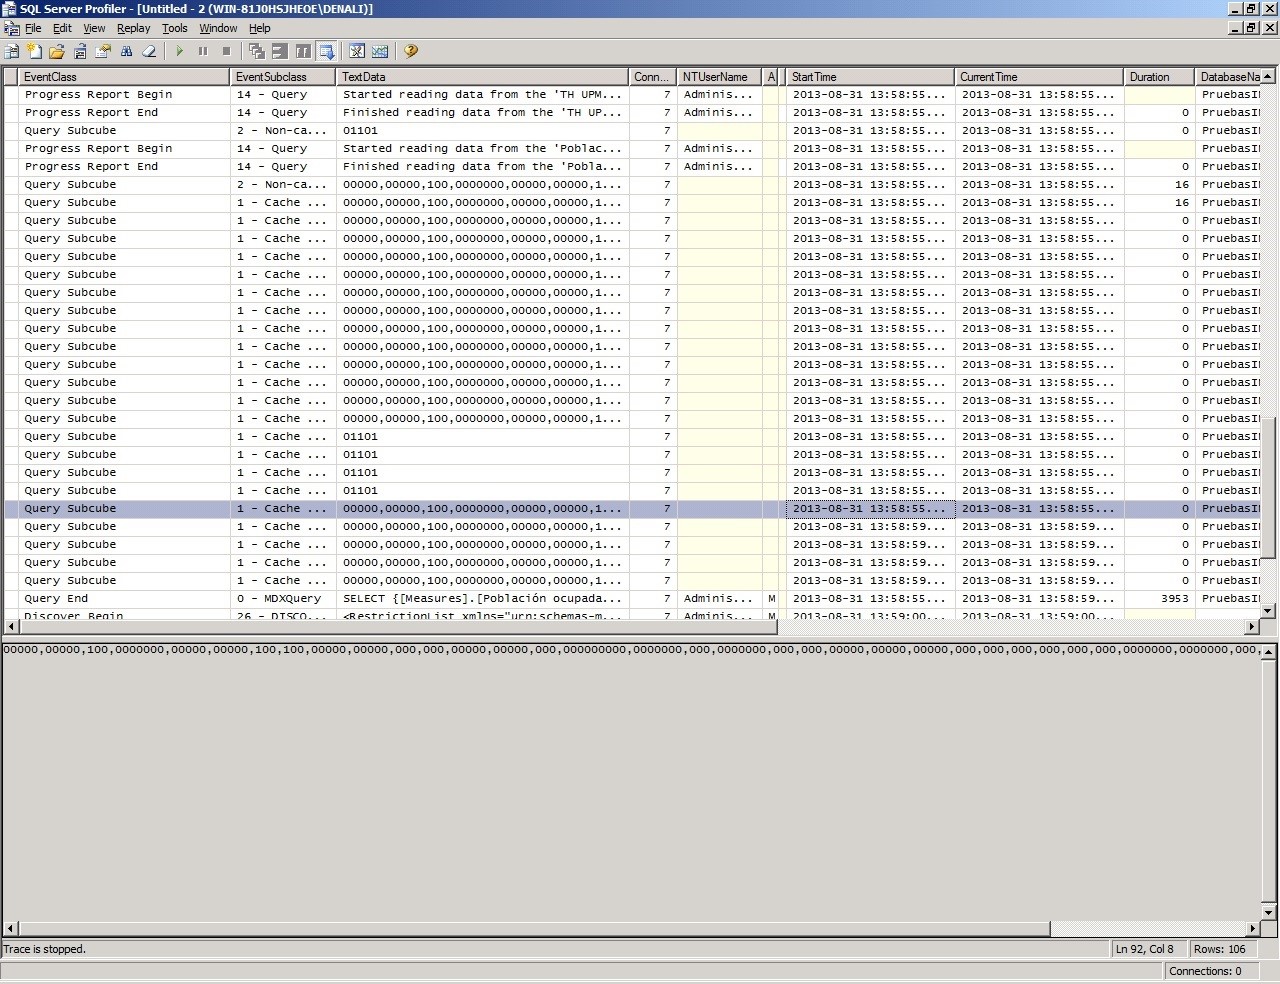
Use the profiler to capture the execution of your query, it is easiest if you do this in an isolated environment but if not possible you can still filter the events from your query using the ConnectionId or some other column.
You need to add the duration for each QuerySubcube, and then subtract that total from the duration shown in the QueryEnd Event. In this example you can see that most subcubes take 0 ms, some of them 16 ms and some other that is not shown in the image was 110 ms. You can also see that the total for the query was 3,953 ms, that means that, in the Storage Engine, Analysis Services spent 142 ms and the difference 3811 ms were spent in the Formula Engine.
In conclusion, we have a Formula Engine Bottleneck, let’s check is that bottleneck is caused by cell by calculation.
The previous procedure may not scale well when you have hundreds of subcubes events or many potential queries using Cell by Cell in the same trace, in that situation you can use a procedure like this one:
- 1. Save the profiler trace to a SQL Server table
- 2. Execute the following SQL Query to obtain a list of the longest running queries
SELECT ROWNUMBER, EVENTCLASS, EVENTSUBCLASS, TEXTDATA, DURATION, CONNECTIONID FROM <TABLE_NAME> WHERE EVENTCLASS=10 - 3. Execute the following SQL Query to get the beginning and ending points of the query in the trace
SELECT TOP 2 ROWNUMBER, EVENTCLASS, EVENTSUBCLASS, TEXTDATA, DURATION, CONNECTIONID FROM <TABLE_NAME> WHERE EVENTCLASS IN (9,10) AND CONNECTIONID=<TARGET_CONNECTIONID> AND ROWNUMBER <= <ROWNUMBER_OF_TARGET_QUERY> ORDER BY ROWNUMBER DESC - 4. Execute the following SQL Query to determine the amount of time spent in storage engine
SELECT SUM(DURATION) FROM <TABLE_NAME> WHERE EVENTCLASS=11 AND CONNECTIONID=<TARGET_CONNECTIONID> AND ROWNUMBER BETWEEN <QUERY_BEGIN_ROWNUMBER> AND <QUERY_END_ROWNUMBER>
Step 2. Identify if the issue is Cell by Cell Calculation
You can use Performance Monitor to identify if the issue is that the calculations is being done Cell By Cell. To be successful in this task is necessary that you run your query in an isolated environment because we have a single counter for all queries and to be sure that our query is the one causing the problems you need to execute it alone, without other concurrent queries. If your query is using Cell By Cell calculation you will see something like the following image in your query.
In the image you can see that the counter being used is “MSOLAP&InstanceName:MDX \ Total Cells Calculated” and the initial value is 0 and the value after you execute the query is a little above 1 million.
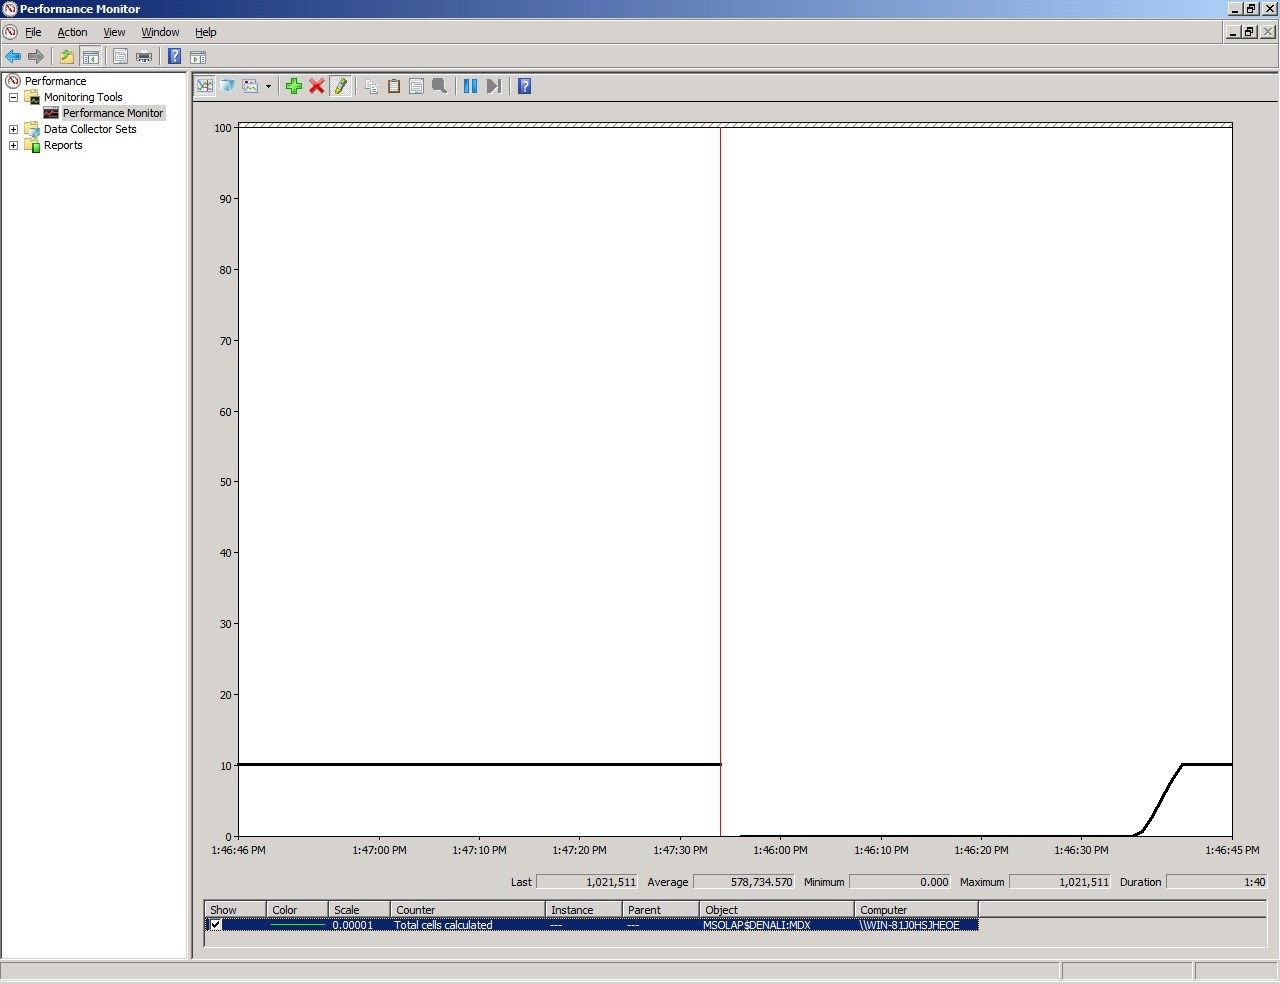
After restarting the instance we can see that a single execution of the query had to calculate more than 1 million rows. If this is the first time you do this, you don’t know if 1 million is too much or too low. I can tell you that is very high for this specific query.
Step 3. Modify your query
Modify the query using the guidelines in the links references until you stop seeing the big increments in cell calculated for your query.
In this particular case the Script was using a couple of expressions like:
Measures.Measure1 ^ 2
We changed the formula to something like:
Measures.Measure1 * Measures.Measure1
After the formula was changed in this particular case we got the following results.
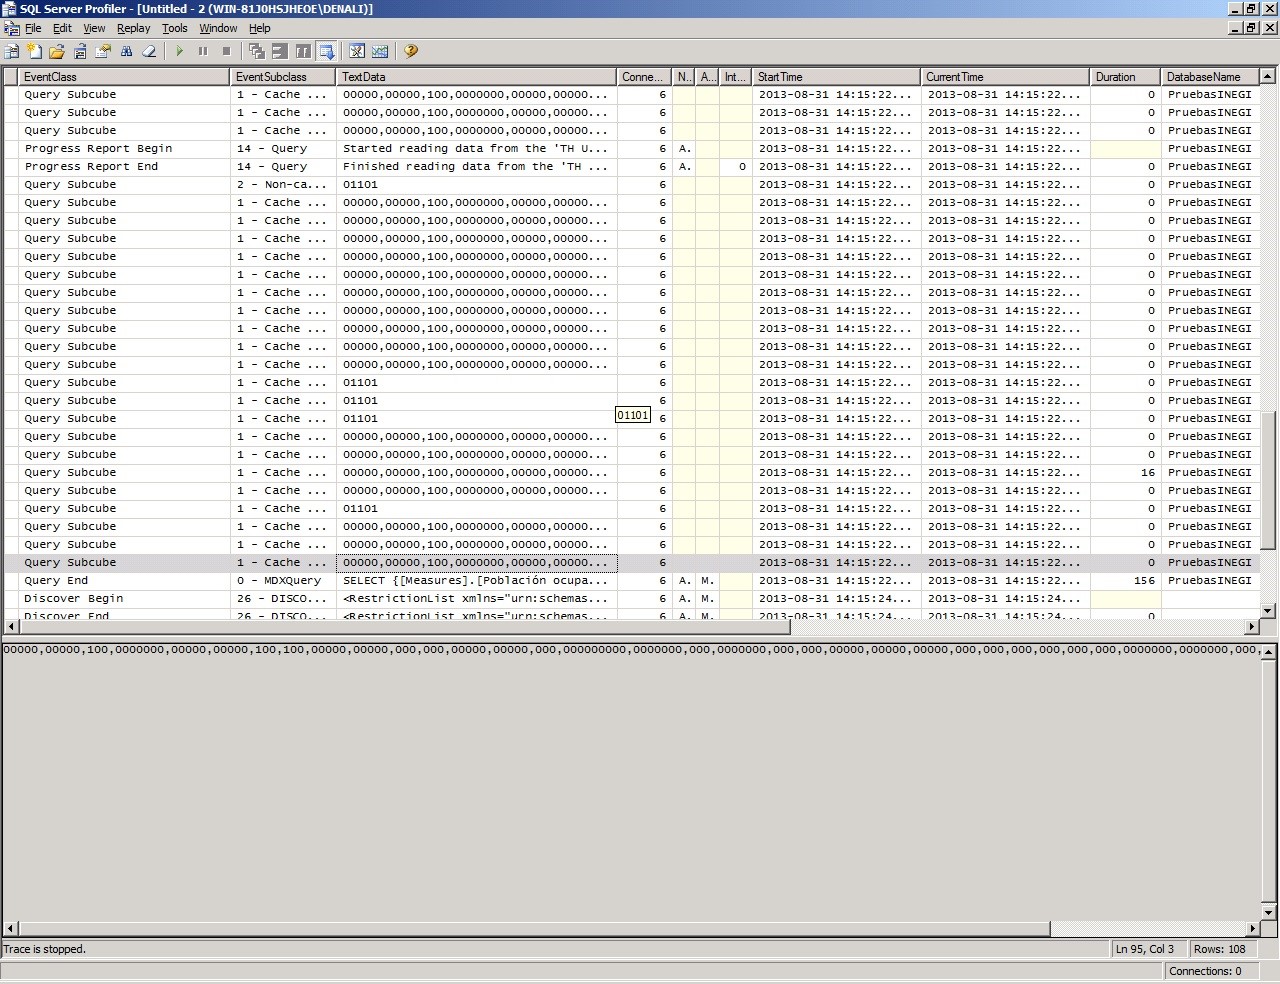
You can see that the total for the query is 156 ms now, considering that the Storage Engine must have used the same time, 132 ms, it means that now the Formula Engine is taking only 24 ms.
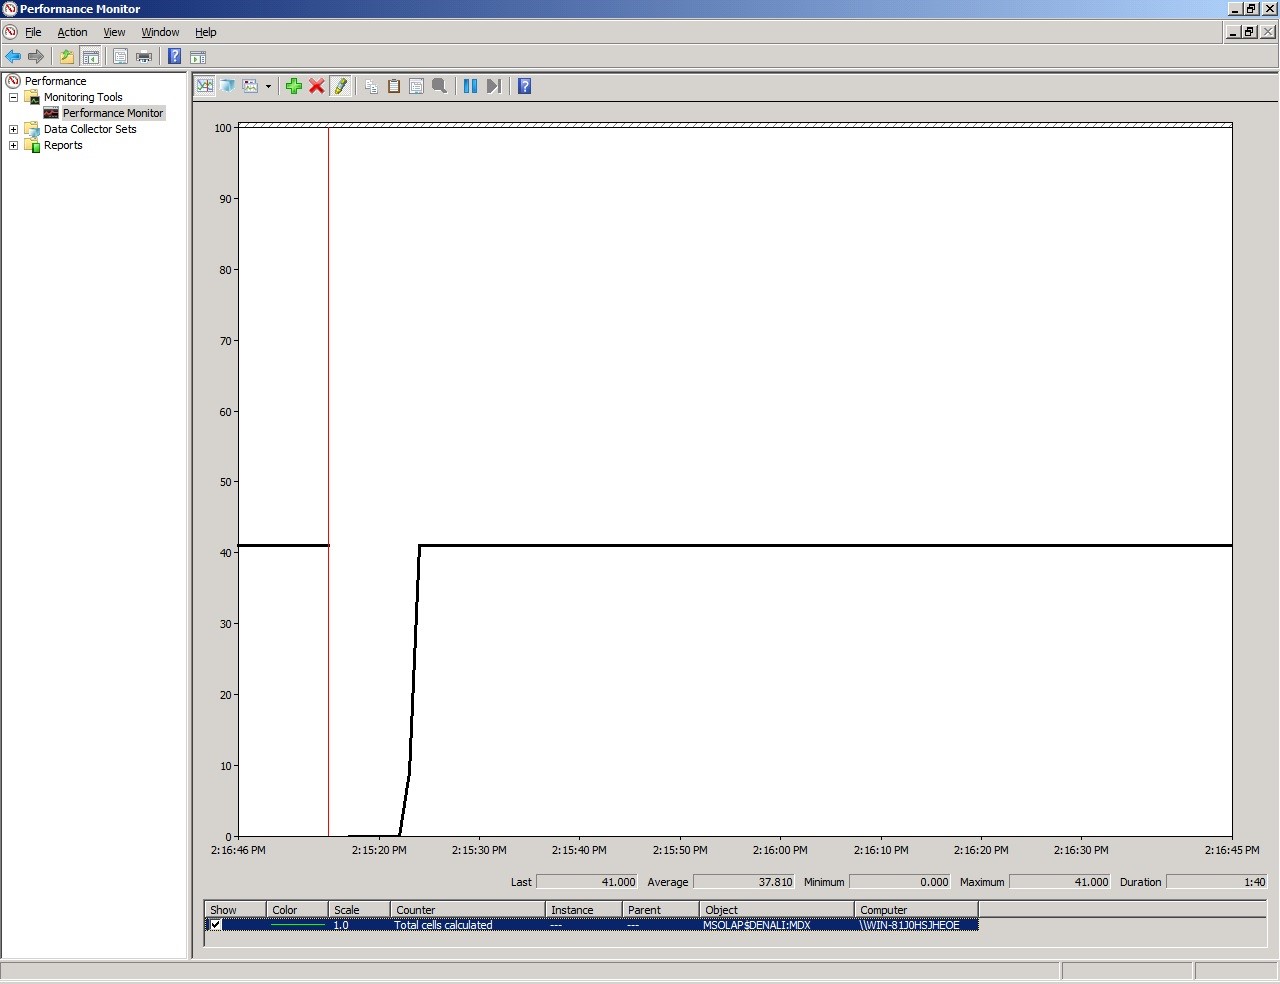
In the performance Monitor we can see that the total number of cell calculated was 41. The query was executed after another restart of the instance.
Final Comments
This is just a basic procedure to find out what is causing the problem on your query. Modifying the query to avoid cell by cell calculation will be easy sometimes, like in this real case, and will be hard in other scenarios.
I hope this is helpful to start troubleshooting your own cases.