Note
Access to this page requires authorization. You can try signing in or changing directories.
Access to this page requires authorization. You can try changing directories.
The ‘Just My Code’ feature in the profiler has a few differences to the ‘Just My Code’ feature in the debugger so this post should provide a useful introduction.
Example Program
Here’s a very simple program I’ll use in this post.
|
Why ‘Just My Code’?
Typically when profiling you are most interested in optimizing code that you either wrote or you have control over. Sure, sometimes there will be issues in the frameworks that you are using or in other binaries, but even then you often control the calls into those frameworks. Just My Code or JMC is intended to filter the data that is displayed in profiler reports so that more of the code you control shows up in the reports and the reports are more manageable.
For example, the Call Tree after collecting sampling data for the simple program above, with JMC off, is shown below:
With the default JMC options, this reduces down to:
What is ‘My Code’?
There are two conditions for code being considered ‘My Code’ by the profiler and they are both at the Module level (Module Name column in the screenshots above). In the example above, this means the checks are made against the clr.dll, mscoreee.dll, mscoreei.dll and ConsoleApplication1.exe binaries.
Modules considered ‘My Code’:
- the copyright string for the module does not contain ‘Microsoft’, OR:
- the module name is the same as the module name generated by building any project in the currently open Solution in Visual Studio.
How do I turn JMC on or off?
You can temporarily toggle JMC on or off on the profiler Summary Page in the Notifications area using ‘Show All Code’ or ‘Hide All Code’ (shown in red below):
The default setting may be configured as discussed in the following section.
How do I configure JMC?
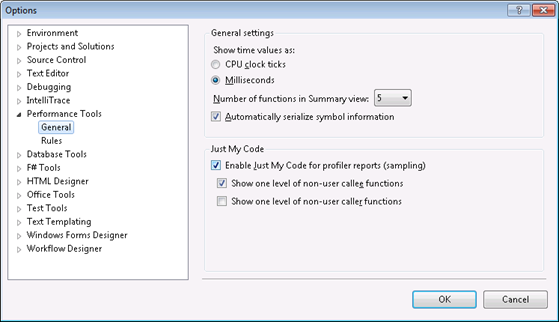
Use Tools –> Options –> Performance Tools –> General and set options in the ‘Just My Code’ section:
The default has JMC on, showing one level of non-user callee functions. In the example above with JMC on, this is why we see the call to COMDouble::Sqrt(dobule) showing up in the call tree.
It is also possible to show one-level of non-user code calling user code, which in the example above would add one level of the non-user code that calls main, as shown below:
Why is ‘Just My Code’ only available for sampling?
When you instrument binaries for profiling, you have already performed some level of JMC. Only binaries that you instrument and first-level calls into other binaries will show up in the instrumentation report, so JMC is not really necessary.
Comments
- Anonymous
August 01, 2011
Is there any document or article about the colors (orange, dark grey, red) used by profiler to highlight the source code?


