VS2010: New Profiler Summary Page
With Visual Studio 2010 we want to make it easier for customers to find and fix performance issues with their code. One of the first things we looked at was the view that shows up after profiling an application – the Summary Page.
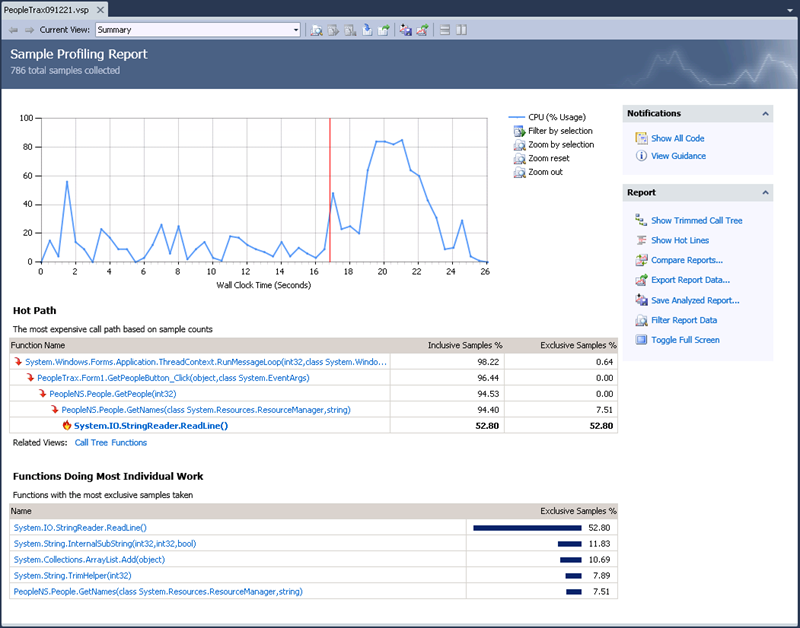
I’ll describe a few features of the new summary page using the PeopleTrax application, which you can download from CodeBox. I won’t describe collecting the profiling data since this is already covered on MSDN. The summary page for a sample profiling run is shown below.
I’ll describe the individual pieces of the report below:
- The header shows the type of data collected (Sample, Instrumentation, etc.) and also how many samples were collected.

- The hot path is shown right on the front page.

We can see straight away that the ReadLine() function is an interesting function to look at. Clicking on the hyperlink will take you directly to the Function Details page. There are also related views links to navigate directly to the ‘Call Tree’ and ‘Functions’ views. - Functions that are doing the most individual work (have the highest Exclusive Samples) are listed with visual ‘sparklines’ (bar charts) to indicate relative importance.

Clicking on the hyperlink for a function takes you directly to the Function Details page for that function. - Notifications that change based on the state of the report are shown in a new ‘Notifications’ area. In the example below, clicking Show All Code will reanalyze the report with Just My Code turned off. ‘View Guidance’ will bring up the Error List to display guidance from the new Rules and Guidance profiler feature.

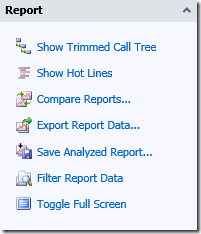
- Action links are shown in the ‘Report’ area and they do not depend on the state of the report. One useful link we added is ‘Toggle Full Screen’ which shows the report in full-screen mode.

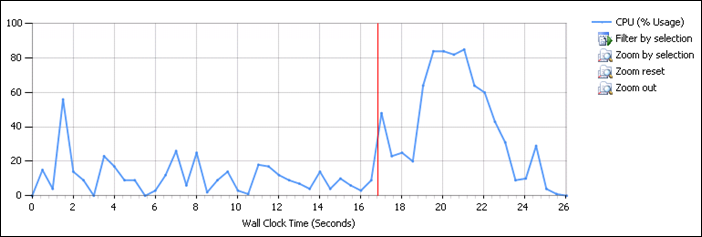
- A chart of CPU usage (for sampling, although we also show contention data in Concurrency mode) enables filtering of the report data. Highlight a region on the chart and choose ‘Filter by selection’ to show data from only that period of time. For example, with the chart below it may be useful to filter between 16 and 24 seconds.

- At the top of the report above the header, we still have the profiler toolbar which is useful for navigating (see the left and right arrows and also the dropdown for jumping between views) and for executing some of the actions that are also listed on the Summary Page.

Hopefully these new features on the front page will make it quicker and easier than ever to diagnose your performance issues.
