New Assessment Dashboard
Introducing the new Assessment Dashboard
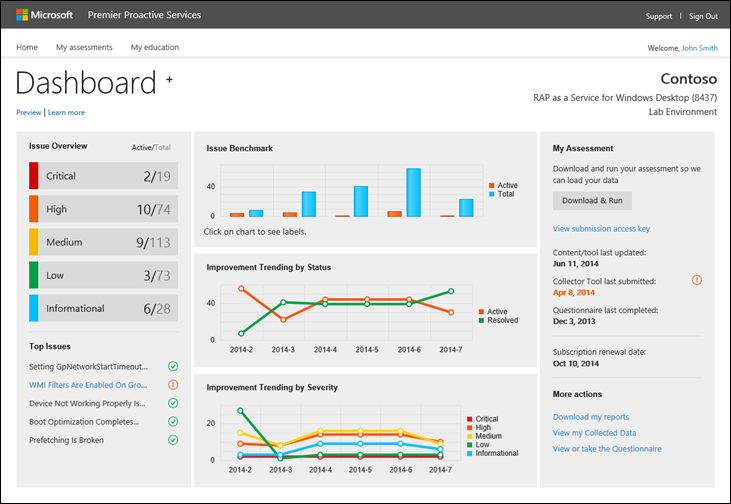
For a long time we've wanted to provide a visual way for customers to gain insights into their RAP as a Service assessment results. Yes, we have the Issues and Collected Data pages, both of which are good if you want to dive into the details. What they lack, however, are visual summaries of key metrics, trends and dates. That's where the Assessment Dashboard comes in.
Introducing the new Assessment Dashboard! This feature is immediately available to all RAP as a Service subscribers. Read on to learn more.
Navigate to the Assessment Dashboard
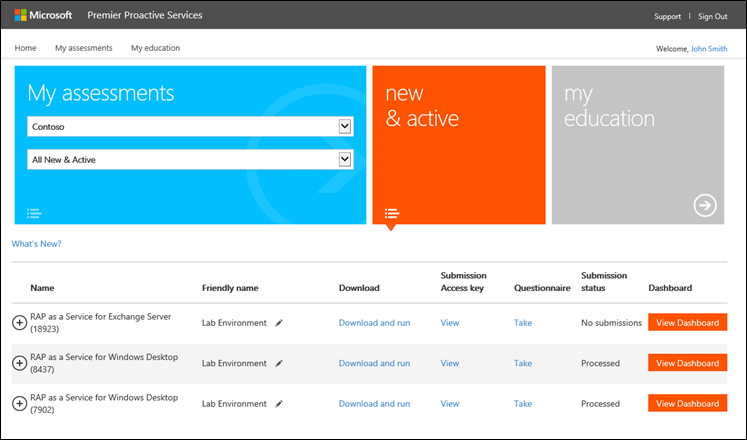
We'll take you directly to the new Assessment Dashboard wherever we can. However, if you need to browse there manually, first navigate to your My Assessments page then click the new View Dashboard link next to the subscription you want to view.
Learn more
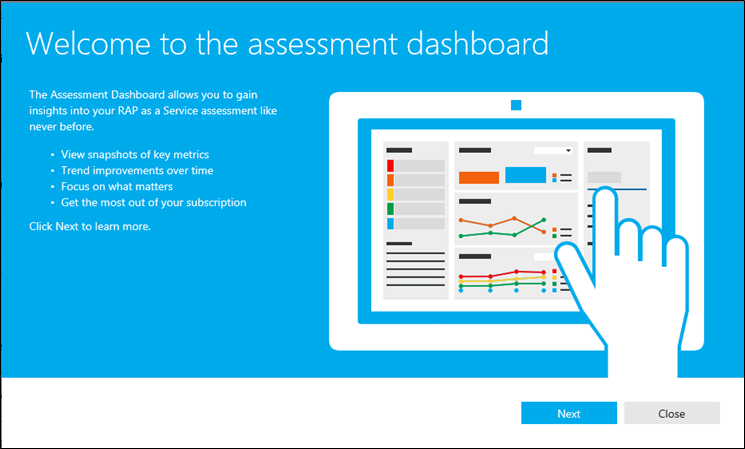
An inline "learn more" experience gives you a great overview of what the Assessment Dashboard is and how to get the most out of it. This experience will automatically appear for most people. You can re-open it via the "Learn more" link at top left of the Assessment Dashboard.
Issue Overview
The number of active issues remains core to how many customers evaluate how their environments are doing during their RAP as a Service subscription period. The Issue Overview section gives you an at-a-glance view at this key information. You can also click on each severity to jump directly to those issues on the new Issues & Risks page.
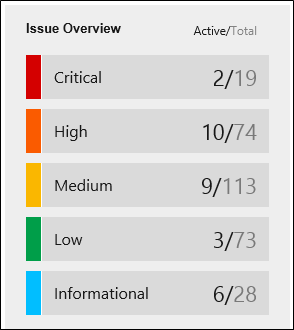
- Each severity is displayed on its own, color-coded row.
- Active / Total shows how many active issues we identified in your environment versus the total possible we evaluated for. In other words, "2 / 19" means there are 2 active critical severity issues out of a possible 19 we evaluated for.
Top Issues
Top Issues is our way of helping break through some of the noise and focus where you need it. What does "Top" mean here? In this case, our teams that develop content reviewed available data to highlight some of the most relevant and impactful issues that applies to the broadest segment of customers. This brings awareness to all customers of this assessment on things that may should definitely pay attention to and whether those issues currently apply to them or not.
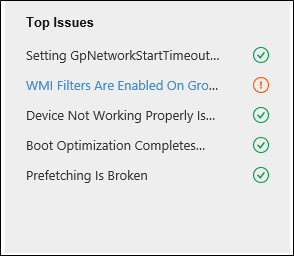
- The top 5 issues are always shown regardless if they were found in your environment.
- If the issue is active in your environment we show an alert icon and allow you to click on the issue to jump directly to it on the new Issues & Risks page.
- Certain issues include a video to provide an even richer viewing experience. You will see a play icon (
 ) for these issues. Click the icon to play the video. The video content is also available on the new Issues & Risks page for these particular issues.
Issue Benchmark
Get a quick snapshot comparison to how your environment is doing across some of the top areas for this assessment with respect to the number of active issues found versus total evaluated.
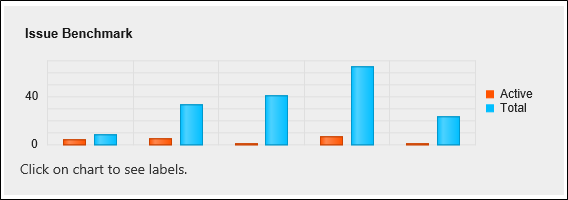
- Up to 5 tags are shown in this chart.
- Active found and total evaluated issue counts are shown per tag.
- Hover over or click on a column to view its labels.
Trends
One of the most commonly requested features has been to show trending data so that customers can more easily see how their environments are doing over time. The engineering work to enable this was fairly large however we're happy to finally give everyone our first set of trending charts.
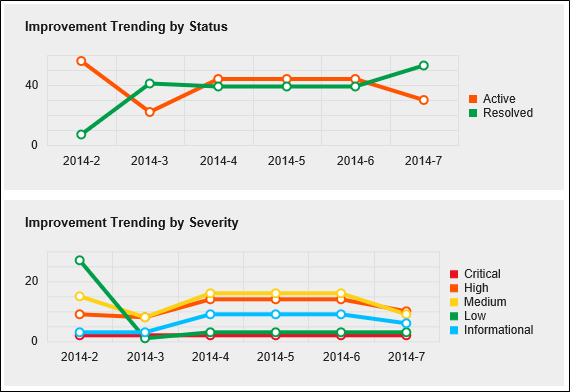
- Improvement Trending by Status shows the total count of Active and Resolved issues over the past 6 months. Use this to easily see whether you are achieving your goals of reducing active issues and increasing resolved issues.
- Improvement Trending by Severity is similar to above except it shows active issue accounts per severity. This allows you to dive a little deeper to know how things look at far as the Critical issues or whatever severity you like.
- You can hide/show elements on the charts by clicking in the legend area. For example, you can hide the Resolved issues if you only want to know how the Active issues are trending.
My Assessment
The My Assessment section gives you a convenient way to keep up with important tasks so that you get the most out of your RAP as a Service subscription.
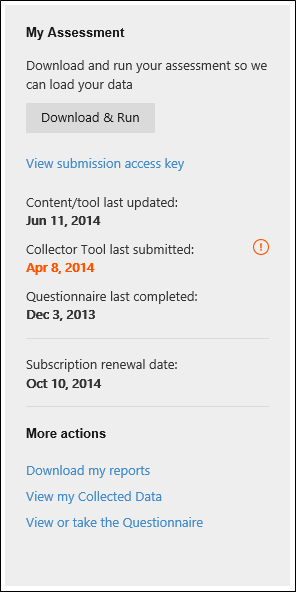
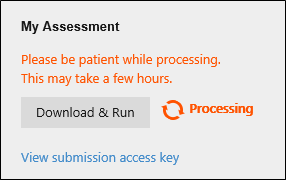
Download & Run
- You have access to updated features, fixes and new content through your subscription period. Regularly downloading and running the latest Collector tool and content is key to getting the most out of your subscription. We recommend customers download & run on a monthly basis.
- Your submission access key, used during the submission step of running the Collector tool, is also available here.
- You can also see whether we are actively processing a submission.
Content/tool last updated
- Our content and Collector tool are updated on a frequent basis. We reinforce this by showing the latest either was last updated.
- You get the latest available content and Collector tool every time you download. Be sure to download, upgrade your Collector tool and load up the latest content package to take advantage of the updates.
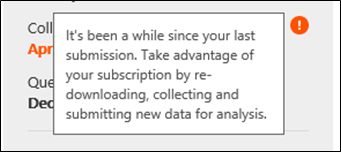
- The Assessment Dashboard will remind you to download and & run if we have recently updated the content/tool and we don't see a submission from you in that timeframe.
Collector Tool last submitted
- This shows the last time we received a submission from your environment via the Collector tool.
- An alert will show if we haven't received a recent submission. Remember, submitting new data (with the latest content/Collector) helps you know where in your environment may need attention.
Questionnaire last completed
- This shows the last time someone completed the operational questionnaire for this assessment.
- You can re-take the questionnaire as often as you like during your subscription period.
Subscription renewal date
- This shows when your subscription is requires renewal.
- You will see an alert when your subscription approaches 60 days to renewal. We highly recommend you work with your Microsoft Technical Account Manager to maintain your subscription benefits.
More actions
- Links to your reports (if published) and other pages are available here.
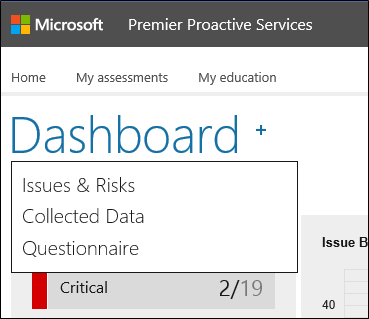
Quick Menu
Something new for all of the assessment-specific pages is this menu that allows you to quickly jump between areas of your assessment. Click on the page title to open the menu.
Get it now
The new Assessment Dashboard is immediately available to all existing and new RAP as a Service subscribers. Sign in to our website and take it for a spin today.