Note
Access to this page requires authorization. You can try signing in or changing directories.
Access to this page requires authorization. You can try changing directories.
SQL Server Extended Events (xevent) are great to troubleshoot many issues including performance issues or other targeted scenarios. But we keep seeing users misusing them to negatively impact their systems.
Here is a latest example. We had a customer who called our support for an issue where the same query ran fast in test but ran slow in production. In fact, the query ‘never’ finished in production in a sense that they waited for 30 minutes or more but couldn’t get it to finish. But the same query finished in seconds in test.
The query was actually a large batch that contains over 90k lines of code with many statements with size of about 800k. Our initial effort focused on comparing the differences between the two servers. But there weren’t many differences. We even eliminated database as a factor. They restored database from production to test and issue went away in test.
Through some troubleshooting, we discovered even parsing the query took a long time in production. But we simply couldn’t figure out what was going on because the statements in the batch were very simple inserts. So we took some user dumps and analyzed the call stacks. Finally we realized that the XEvent was involved. Every dump we got showed the server was producing XEvent. It turned out their developers enabled the some xevents which can cause high overhead by accident inproduction.
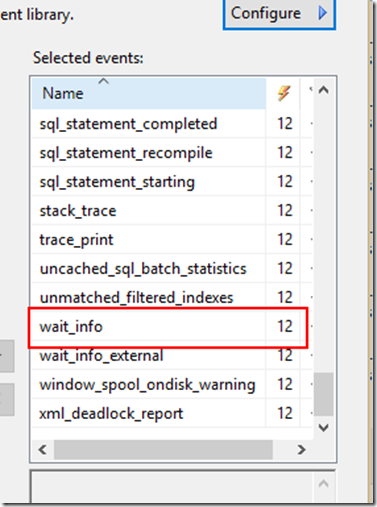
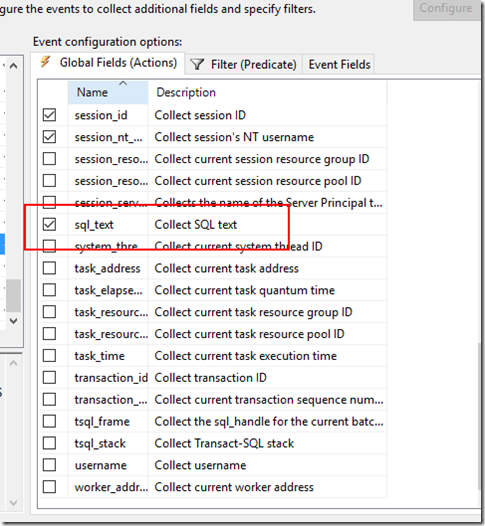
So we got their Xevents being captured (screen shot below). Among those, there were scan_started, scan_stopped, wait_info etc. It was generate a million events every minute without anyone else running the system. In addition to that, this customer captured sql_text for all the events. Basically the same 800k batch text would be captured for every event including wait_info etc
None of the events mentioned (scan_started, scan_stopped, wait_info ) are suited for long term capture. For this specific scenario, it was wait_info that hurt them most (combined with sql_text being included). Wait_info is produced whenever there is a scheduler yield or wait is finished. Because customer’s batch is very large, SQL needs to play nice and yields frequently. so the event gets triggered very frequently. That’s why so many events were generated and overhead led to slowdown.
Demo (tested on SQL Server 2012, 2016)
create and enable Xevents
CREATE EVENT SESSION [test_xevent] ON SERVER
ADD EVENT sqlos.wait_info(
ACTION(package0.collect_system_time,sqlserver.client_app_name,sqlserver.client_hostname,sqlserver.context_info,sqlserver.database_name,sqlserver.nt_username,sqlserver.plan_handle,sqlserver.query_hash,sqlserver.query_plan_hash,sqlserver.session_id,sqlserver.session_nt_username,sqlserver.sql_text) ),
ADD EVENT sqlos.wait_info_external(
ACTION(package0.collect_system_time,sqlserver.client_app_name,sqlserver.client_hostname,sqlserver.context_info,sqlserver.database_name,sqlserver.nt_username,sqlserver.plan_handle,sqlserver.query_hash,sqlserver.query_plan_hash,sqlserver.session_id,sqlserver.session_nt_username,sqlserver.sql_text) )
ADD TARGET package0.event_counter,
ADD TARGET package0.event_file(SET filename=N'c:\temp\test_xevent.xel')
WITH (MAX_MEMORY=4096 KB,EVENT_RETENTION_MODE=ALLOW_SINGLE_EVENT_LOSS,MAX_DISPATCH_LATENCY=30 SECONDS,MAX_EVENT_SIZE=0 KB,MEMORY_PARTITION_MODE=NONE,TRACK_CAUSALITY=ON,STARTUP_STATE=ON)
GO
alter event session [test_xevent] on server state = start
in SSMS, duplicate “INSERT INTO t VALUES (null,null,null)” 50,000 times and try parsing the query. it will take several minutes. but if you disable the Xevent session, the entire batch will parse in seconds.
If you have to capture wait_info for large batch like this one, consider taking out sql_text. It will be hard to look at the trace afterwards without it. But hopefully, it is a controlled environment and you know which session you are troubleshooting and filter on that.
Jack Li |Senior Escalation Engineer | Microsoft SQL Server

