(updated 6/11/2010 with some additonal information)
One of the more common questions I see is how to create a monitor for a UNIX or Linux computer that runs a script and returns a value? The question actually comes in several forms. Some people want a simple monitor to check for the existence or state of something, some want multiple-instance capabilities (multiple NFS shares, for example), and some want performance monitoring that will return a number of properties. This article will describe the first case – where you want to find out if something is out there and its current state by using a script. I’ll tackle the other two topics later on.
So the first thing to note here is that this is a simple demonstration, but can be adapted to many purposes. While the script I run is just a demo script and doesn’t do anything special, you can adapt the concept into much more complex circumstances. And, you really don’t even have to run a script at all – you can just run a command line or set of command lines in one command.
The Set Up
OK, so what I have is a Management Pack (which you can download from CodePlex here) that defines a three-state monitor. The states are based on a return code from the script of 0, 1 or 2. This determines whether the monitor shows Success (0), Warning (1), or Error (2). As with the existing UNIX and Linux MPs that run scripts to do things like deploy the agent, we use the WS-Man Invoke ProbeAction to run the command. What this does is call through WS-Man using our basic credentials to issue the command line action.
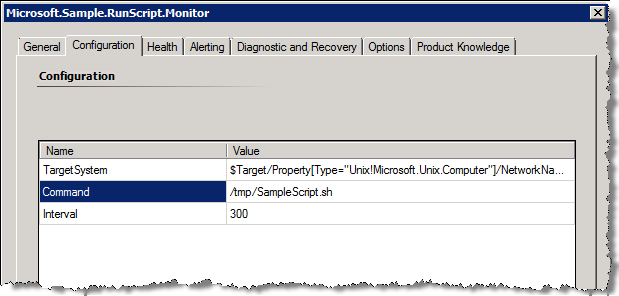
In the implementation of the monitor, the state values are defined along with the command line to be used, as well as the interval between attempts. All of these are changeable in the MP since it's not sealed. I also define a task that does the same thing as the monitor, but this is just for testing so you can run the script more often than the standard interval. It’s actually very handy for testing incremental changes in scripts.
You could also, instead of calling an external script, issue a command line that contains multiple commands that essentially does the same thing. It's a little harder to read than an external script, but in the end might be easier to implement since you don't have to push a script to the end nodes first.
The Script – SampleScript.sh
First of all, here is the script that I wrote to put on the remote Linux machine. All it does it loop through my three states. First time it runs, it returns an exit code ($EC) of 0. The second time it runs, it returns an exit code of 1. The third time it returns an exit code of 2. Then it starts back over at 0. It does this just by setting a flag file to know which branch to take each time it runs.
I put this script on the Linux computer in the /tmp directory.
#!/bin/shif [ -f /tmp/test2 ]then rm -f /tmp/test2 echo "Found Test 1 already run. Exiting with 2" exit 2elif [ -f /tmp/test1 ]then rm -f /tmp/test1 touch /tmp/test2 echo "Found Test 0 already run. Exiting with 1" exit 1else touch /tmp/test1 echo "First test. Exiting with 0" exit 0fi
|
If you plan on using this example for a real world application monitor, all you need to do is write your own script that returns an exit code of 0, 1, or 2 and drop it on the machines you want to monitor (or use a command line that does the same) and then change the command used in the MP to run the script.
The Management Pack
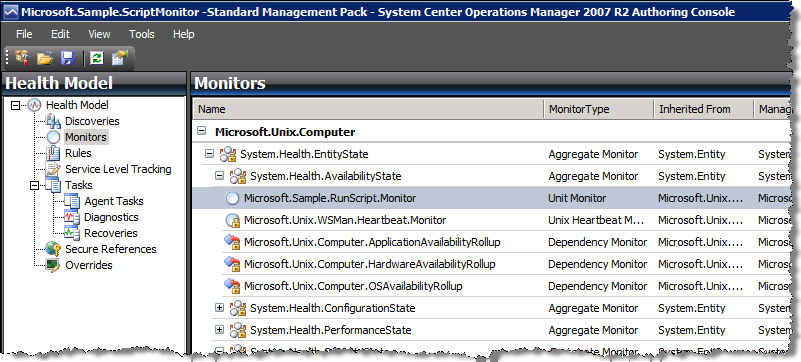
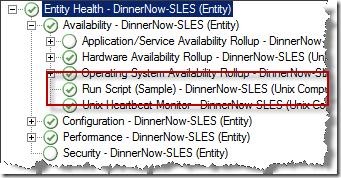
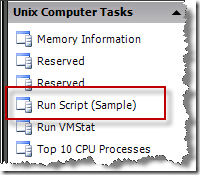
The MP ((which you can download from CodePlex here) is targeted at the Unix.Computer class, so it should be available to any Unix or Linux computer. When I import the MP, I get a new monitor under Availability, as well as a new Task in the list.


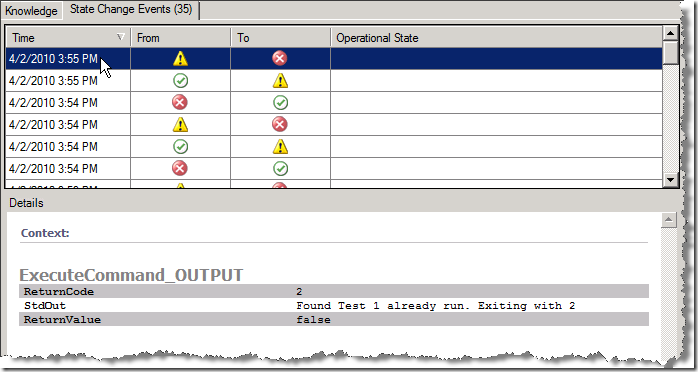
And every time the monitor fires and runs the script, it changes my monitor status:

I happen to have the timeout set at 15 seconds, which is OK for this test but something you would NEVER do in real life :)
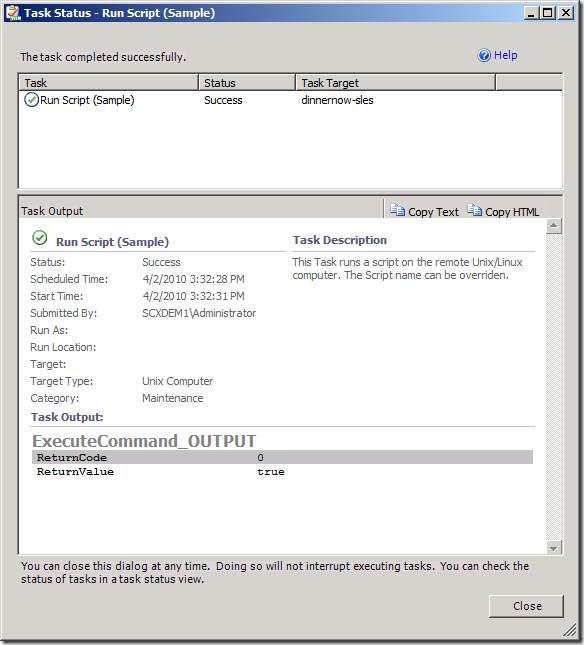
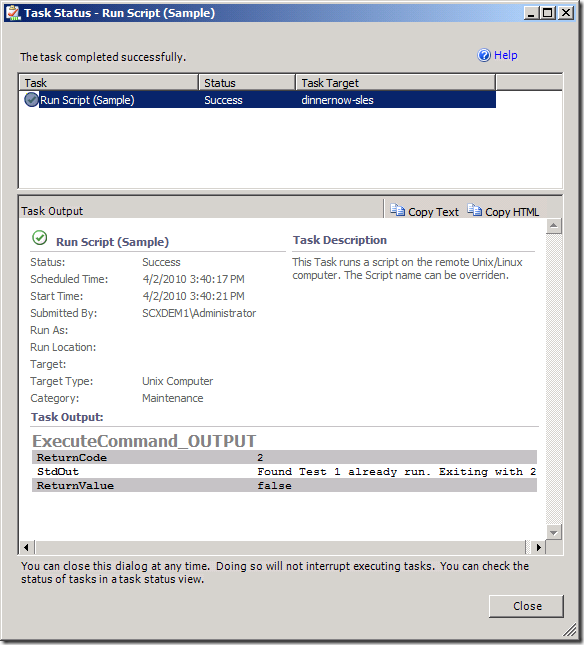
Here are some screen shots of what is displayed when you run the task manually.


Here is the Management Pack code – you can also download the MP XML file from CodePlex in our Community Extensions project.
<?xml version="1.0" encoding="utf-16"?><ManagementPack xmlns:xsd="https://www.w3.org/2001/XMLSchema" xmlns:xsl=https://www.w3.org/1999/XSL/Transform ContentReadable="true" > <Manifest> <Identity> <ID>Microsoft.Sample.ScriptMonitor</ID> <Version>6.1.7221.10</Version> </Identity> <Name>Sample UNIX/Linux Script Monitor</Name> <References> <Reference Alias="SCDW"> <ID>Microsoft.SystemCenter.DataWarehouse.Library</ID> <Version>6.1.7221.0</Version> <PublicKeyToken>31bf3856ad364e35</PublicKeyToken> </Reference> <Reference Alias="Windows"> <ID>Microsoft.Windows.Library</ID> <Version>6.1.7221.0</Version> <PublicKeyToken>31bf3856ad364e35</PublicKeyToken> </Reference> <Reference Alias="ReportLibrary"> <ID>Microsoft.SystemCenter.DataWarehouse.Report.Library</ID> <Version>6.1.7221.0</Version> <PublicKeyToken>31bf3856ad364e35</PublicKeyToken> </Reference> <Reference Alias="System"> <ID>System.Library</ID> <Version>6.1.7221.0</Version> <PublicKeyToken>31bf3856ad364e35</PublicKeyToken> </Reference> <Reference Alias="SC"> <ID>Microsoft.SystemCenter.Library</ID> <Version>6.1.7221.0</Version> <PublicKeyToken>31bf3856ad364e35</PublicKeyToken> </Reference> <Reference Alias="SystemHealth"> <ID>System.Health.Library</ID> <Version>6.1.7221.0</Version> <PublicKeyToken>31bf3856ad364e35</PublicKeyToken> </Reference> <Reference Alias="Unix"> <ID>Microsoft.Unix.Library</ID> <Version>6.1.7000.248</Version> <PublicKeyToken>31bf3856ad364e35</PublicKeyToken> </Reference> </References> </Manifest> <TypeDefinitions> <MonitorTypes> <UnitMonitorType ID="Microsoft.Sample.RunScript.MonitorType" Accessibility="Public"> <MonitorTypeStates> <MonitorTypeState ID="RCZERO" NoDetection="false" /> <MonitorTypeState ID="RCONE" NoDetection="false" /> <MonitorTypeState ID="RCTWO" NoDetection="false" /> </MonitorTypeStates> <Configuration> <xsd:element xmlns:xsd="https://www.w3.org/2001/XMLSchema" name="TargetSystem" type="xsd:string" /> <xsd:element xmlns:xsd="https://www.w3.org/2001/XMLSchema" name="Command" type="xsd:string" /> <xsd:element xmlns:xsd="https://www.w3.org/2001/XMLSchema" name="Interval" type="xsd:unsignedInt" /> </Configuration> <OverrideableParameters> <OverrideableParameter ID="Command" Selector="$Config/Command$" ParameterType="string" /> <OverrideableParameter ID="Interval" Selector="$Config/Interval$" ParameterType="int" /> </OverrideableParameters> <MonitorImplementation> <MemberModules> <DataSource ID="Scheduler" TypeID="System!System.Scheduler"> <Scheduler> <SimpleReccuringSchedule> <Interval Unit="Seconds">$Config/Interval$</Interval> <SyncTime /> </SimpleReccuringSchedule> <ExcludeDates /> </Scheduler> </DataSource> <ProbeAction ID="RunScript" TypeID="Unix!Microsoft.Unix.WSMan.Invoke.ProbeAction"> <TargetSystem>$Target/Property[Type="Unix!Microsoft.Unix.Computer"]/PrincipalName$</TargetSystem> <Uri>https://schemas.microsoft.com/wbem/wscim/1/cim-schema/2/SCX_OperatingSystem?__cimnamespace=root/scx</Uri> <Selector /> <InvokeAction>ExecuteCommand</InvokeAction> <Input><![CDATA[ <p:ExecuteCommand_INPUT xmlns:p="https://schemas.microsoft.com/wbem/wscim/1/cim-schema/2/SCX_OperatingSystem"> <p:command>$Config/Command$</p:command> <p:timeout>10</p:timeout> </p:ExecuteCommand_INPUT>]]></Input> </ProbeAction> <ConditionDetection ID="CDZERO" TypeID="System!System.ExpressionFilter"> <Expression> <SimpleExpression> <ValueExpression> <XPathQuery Type="Double">//*[local-name()="ReturnCode"]</XPathQuery> </ValueExpression> <Operator>Equal</Operator> <ValueExpression> <Value Type="Double">0</Value> </ValueExpression> </SimpleExpression> </Expression> </ConditionDetection> <ConditionDetection ID="CDONE" TypeID="System!System.ExpressionFilter"> <Expression> <SimpleExpression> <ValueExpression> <XPathQuery Type="Double">//*[local-name()="ReturnCode"]</XPathQuery> </ValueExpression> <Operator>Equal</Operator> <ValueExpression> <Value Type="Double">1</Value> </ValueExpression> </SimpleExpression> </Expression> </ConditionDetection> <ConditionDetection ID="CDTWO" TypeID="System!System.ExpressionFilter"> <Expression> <SimpleExpression> <ValueExpression> <XPathQuery Type="Double">//*[local-name()="ReturnCode"]</XPathQuery> </ValueExpression> <Operator>Equal</Operator> <ValueExpression> <Value Type="Double">2</Value> </ValueExpression> </SimpleExpression> </Expression> </ConditionDetection> </MemberModules> <RegularDetections> <RegularDetection MonitorTypeStateID="RCZERO"> <Node ID="CDZERO"> <Node ID="RunScript"> <Node ID="Scheduler" /> </Node> </Node> </RegularDetection> <RegularDetection MonitorTypeStateID="RCONE"> <Node ID="CDONE"> <Node ID="RunScript"> <Node ID="Scheduler" /> </Node> </Node> </RegularDetection> <RegularDetection MonitorTypeStateID="RCTWO"> <Node ID="CDTWO"> <Node ID="RunScript"> <Node ID="Scheduler" /> </Node> </Node> </RegularDetection> </RegularDetections> </MonitorImplementation> </UnitMonitorType> </MonitorTypes> </TypeDefinitions> <Monitoring> <Tasks> <Task ID="Microsoft.Sample.RunScript.Task" Accessibility="Public" Enabled="true" Target="Unix!Microsoft.Unix.Computer" Timeout="300" Remotable="true"> <Category>Maintenance</Category> <ProbeAction ID="RunScript" TypeID="Unix!Microsoft.Unix.WSMan.Invoke.ProbeAction"> <TargetSystem>$Target/Property[Type="Unix!Microsoft.Unix.Computer"]/PrincipalName$</TargetSystem> <Uri>https://schemas.microsoft.com/wbem/wscim/1/cim-schema/2/SCX_OperatingSystem?__cimnamespace=root/scx</Uri> <Selector /> <InvokeAction>ExecuteCommand</InvokeAction> <Input><![CDATA[ <p:ExecuteCommand_INPUT xmlns:p="https://schemas.microsoft.com/wbem/wscim/1/cim-schema/2/SCX_OperatingSystem"> <p:command>/tmp/SampleScript.sh</p:command> <p:timeout>10</p:timeout> </p:ExecuteCommand_INPUT>]]></Input> </ProbeAction> </Task> </Tasks> <Monitors> <UnitMonitor ID="Microsoft.Sample.RunScript.Monitor" Accessibility="Public" Enabled="true" Target="Unix!Microsoft.Unix.Computer" ParentMonitorID="SystemHealth!System.Health.AvailabilityState" Remotable="true" Priority="Normal" TypeID="Microsoft.Sample.RunScript.MonitorType" ConfirmDelivery="false"> <Category>PerformanceHealth</Category> <AlertSettings AlertMessage="Microsoft.Sample.RunScript.AlertMessage"> <AlertOnState>Warning</AlertOnState> <AutoResolve>true</AutoResolve> <AlertPriority>Normal</AlertPriority> <AlertSeverity>Error</AlertSeverity> </AlertSettings> <OperationalStates> <OperationalState ID="Success" MonitorTypeStateID="RCZERO" HealthState="Success" /> <OperationalState ID="Warning" MonitorTypeStateID="RCONE" HealthState="Warning" /> <OperationalState ID="Error" MonitorTypeStateID="RCTWO" HealthState="Error" /> </OperationalStates> <Configuration> <TargetSystem>$Target/Property[Type="Unix!Microsoft.Unix.Computer"]/NetworkName$</TargetSystem> <Command>/tmp/SampleScript.sh</Command> <Interval>300</Interval> </Configuration> </UnitMonitor> </Monitors> </Monitoring> <Presentation> <StringResources> <StringResource ID="Microsoft.Sample.RunScript.AlertMessage" /> </StringResources> </Presentation> <LanguagePacks> <LanguagePack ID="ENU" IsDefault="true"> <DisplayStrings> <DisplayString ElementID="Microsoft.Sample.ScriptMonitor"> <Name>Script Monitor (Sample)</Name> <Description>This MP shows how to run a script on a remote Unix/Linux computer and set a Monitor state based on the return code.</Description> </DisplayString> <DisplayString ElementID="Microsoft.Sample.RunScript.Task"> <Name>Run Script (Sample)</Name> <Description>This Task runs a script on the remote Unix/Linux computer. The Script name can be overridden.</Description> </DisplayString> <DisplayString ElementID="Microsoft.Sample.RunScript.Monitor"> <Name>Run Script (Sample)</Name> <Description>This Monitor runs a script on the remote Unix/Linux computer and based on the Return Code sets the Monitor state.</Description> </DisplayString> <DisplayString ElementID="Microsoft.Sample.RunScript.AlertMessage"> <Name>An Error has been detected (Sample)</Name> <Description>A Script has been executed on the remote Unix/Linux computer and the return code indicates a problem.</Description> </DisplayString> </DisplayStrings> </LanguagePack> </LanguagePacks></ManagementPack>
|
NOTE: When you load the MP, it will start to run on any machine that has the script. If you don't want it to run for all machines, you should reconfigure the target class to something different. To do this, just open the MP in the Authoring Console (not the Authoring pane in the Admin Console) and go to Monitors > Microsoft.Unix.Computer > System.Health.EntityState > System.Health.AvailabilityState then right-click on Microsoft.Sample.RunsScript.Monitor and select Properties. Click the button next to Target and select a new target from the list. If the target you want is not in the list, you'll need to add that MP as a reference, then go back and do this.

Finally, if you want to change the script name that runs, just go to the properties like above and click on the Configuration tab, and change the value of Command.

Enjoy!
Anonymous
June 17, 2010
I really appreciate this article thanks for taking ther time to explain this....
Anonymous
July 27, 2010
I was hoping you had written an article on performance monitoring that will return a number of properties.
I would like to be able run a stats script on a memcached server and create performance graphs based on the output. Any chance you have covered this?
Anonymous
July 28, 2010
Hi Ryan,
I haven't covered multi-value return data yet, sorry. This basically requires having a shell script that runs on the remote computer that returns information formatted in a way that (probably XML) it can be converted to property bags for OpsMgr. I have this on my list to research, but haven't found any good existing samples of of how to do it. It might require running a VBScript or PowerShell that writes out the shell script and then processes the return string, but I haven't done all the digging yet to find the right / best solution.
Anonymous
May 11, 2011
I got this working - This is great and has opened up many opportunities for Unix/Linux/Solaris !

