Search Performance: A case of AV slowing down crawls
In the services world supporting Search, I commonly see the nasty impact of Anti-Virus (AV) on the performance of SharePoint Search. Before diving into this scenario, I want to first reiterate the following KB:
Certain folders may have to be excluded from antivirus scanning when you use file-level antivirus software in SharePoint https://support.microsoft.com/en-us/kb/952167
Which states:
These folders may have to be excluded from antivirus scanning when you use file-level antivirus software in SharePoint. If these folders are not excluded, you may see unexpected behavior. For example, you may receive "access denied" error messages when files are uploaded.
Admittedly, that statement seems a bit ambiguous, but I whole-heartedly recommend the exceptions and hope to convince you of their need with the all-too-common scenario described below.
The [representative] scenario...
The consequence of Anti-Virus locking out files can manifest in many different ways. In some cases, the signs are obvious (e.g. the IO Exception "The process cannot access the file because it is being used by another process"), whereas others throw no particular exception, but instead exhibit terrible performance (e.g. very low documents per second processed). Further, I've also seen several cases where AV ultimately led to Index replicas regularly cycling through degraded states.
The point... there is no single path to failure caused by AV, but I'll try to walk you through some representative scenarios. Conversely, other factors can cause similar performance impacts, too (e.g. saturated network, poor disk, etc)
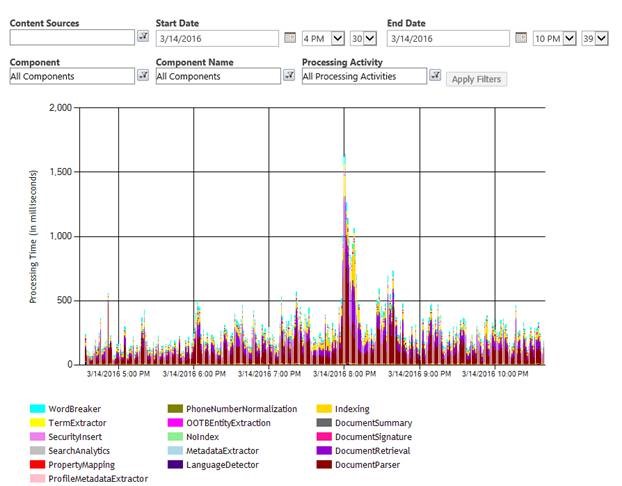
...but for now, we'll focus on AV (and for anyone asking... that is a great example of AV totally wrecking the performance in my lab).
Follow the money crawl flow...
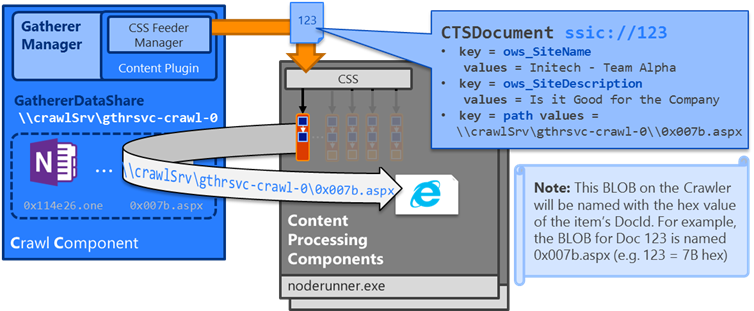
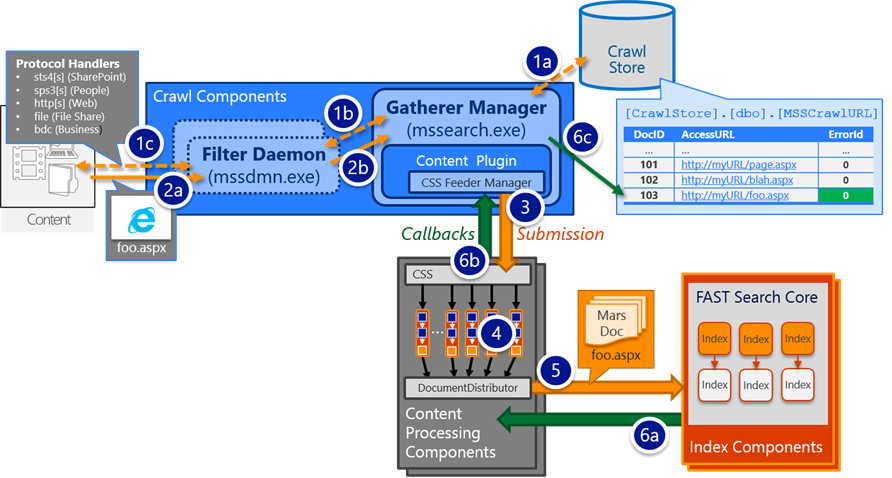
As we dive in, I will refer to the following high level flow for a crawl when describing a particular point of a crawl:
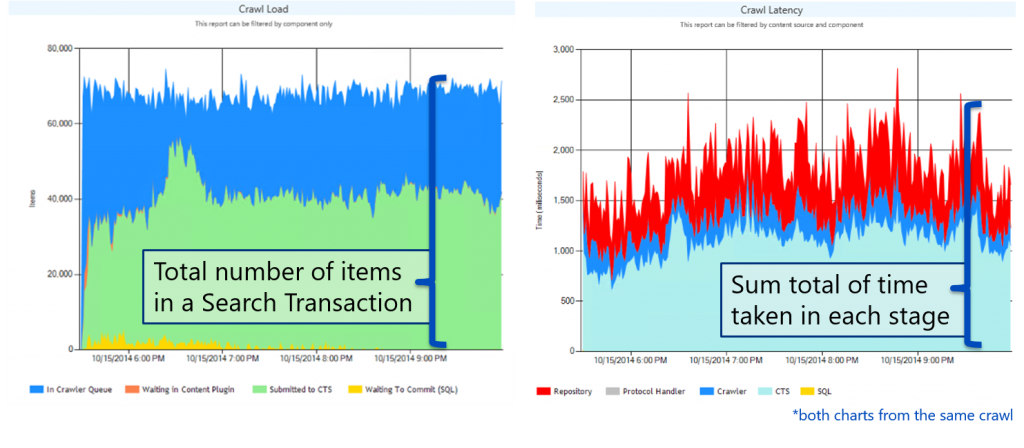
The Crawl Load report (found in Central Admin -> Crawl Health Reports -> in the Crawl Latency tab) illustrates the number of items being processed by the system at any a given moment in time, whereas the Crawl Latency chart (in the same tab, but presented under the Crawl Load chart) shows you the latency for various stages. At Ignite (around the 47m 30s mark), I talked about the Crawl Load report and noted that I use it as my starting point when troubleshooting any crawl performance issue.
For the Crawl Load, I use the analogy of cars on the road. If you take an aerial photo of rush hour traffic, you would see a lot of cars on the road, but have no real measure of how fast each car is actually moving. Being said, if in that photo you could see that lots of cars where packing in between mile marker 10 and 11, then there was likely something between mile marker 11 and 12 causing a slow-down (e.g. all the cars on the road are backed up by some bottleneck further down the road).
This Crawl Load chart is similar in that we can see where the items are in the system as they are being processed. Although overly simplified, it may also help to think about this Crawl Load chart as an indicator of where the Crawl Component’s [gatherer, aka “robot”] threads are currently working (e.g. each thread is working on some batch of items at any given time, which is why the chart shows number of items in the Y axis instead of threads). To take out the previous analogy further, each car [thread] is moving a batch of people [items] down the road [crawl flow].
When a crawl is flowing well, you'd typically expect to see a roughly even split of items in the "In Crawler Queue" and "Submitted to CTS". In other words, about half of the threads are busy gathering new items to process and the other half of threads are waiting for callbacks on items being processed.
However...
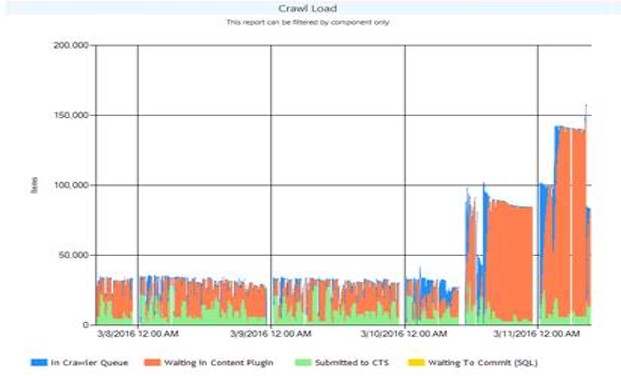
...here we see the threads are mostly pooling in "Waiting in Content Plugin" (e.g. between steps 2b and 3 from the flow illustration above) and in “Submitted to CTS” (which means the threads are waiting on a callback until the processing in steps 3 to 6b completed). Going back to the traffic analogy again, we would expect to see corresponding bottlenecks somewhere down the road, which we can see using the "Content Processing Activity" report.
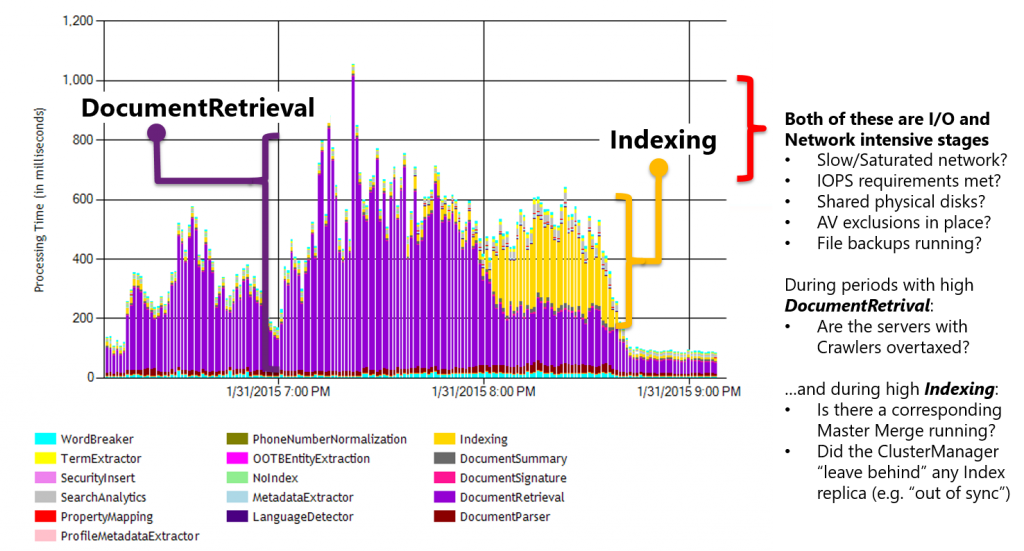
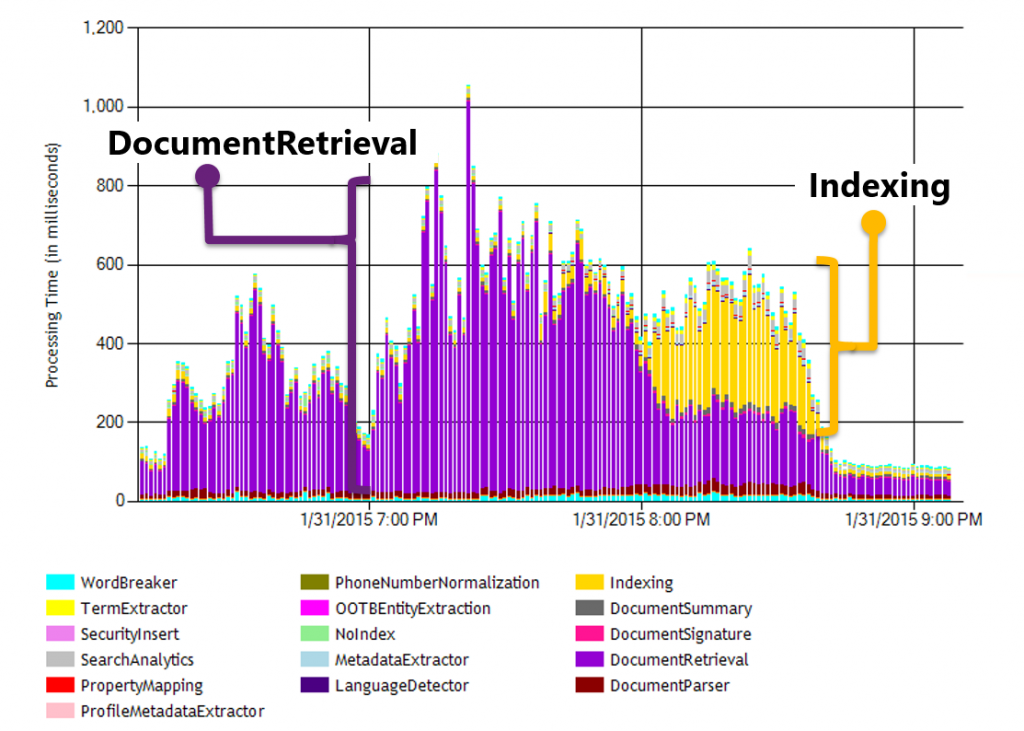
The very first chart at the top of this post (e.g. the "Content Processing Activity" report dominated by purple [DocumentRetrieval] and gold [Indexing] values) best illustrates the negative impact that AV can have on crawling...
Scenario 1: DocumentRetrieval
In my post here describing the various paths used during a crawl, we can see that the Content Processing Component reaches back to the Crawl Component (via the GathererDataShare) during the DocumentParsing stage in the processing flow (during step 4 above) to retrieve an item's blob. For example:
When AV interferes with this retrieval over the GathererDataShare file share... well, you see lots of purple [DocumentRetrieval] in the "Content Processing Activity" report.
Scenario 2: Indexing
For this particular customer, the DocumentRetrieval stage was playing nice. Instead, we found GIGANTIC delays in "Indexing" (steps 5 and 6a in the flow above)
*(apologies for the grainy images, but that is ~170 seconds for each item) 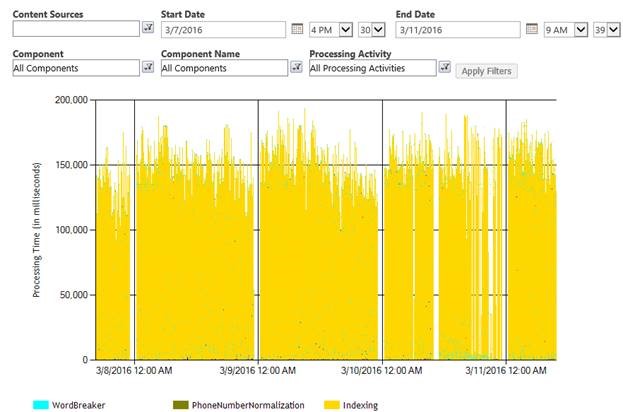
After disabling AV, the very same system processed most items in ~200-300 milliseconds as seen below:
Into the weeds...
As I described further in this post (in the section labeled Glimpse into the Mechanics for Managing the Index about 25% into that post), the Index regularly creates, merges, and deletes many small files as part of the normal processing.
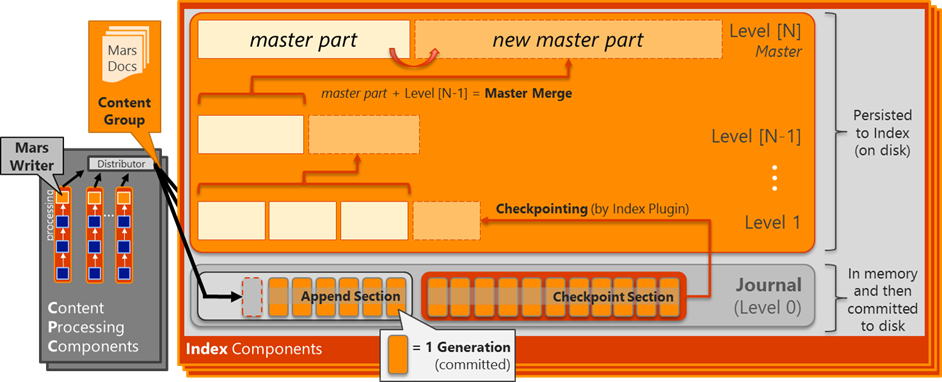
"Index files are never directly modified. Instead, when the Index parts on one level become >10% of the level above, they are "merged" into a new part file at that next level above. After the merging has completed, the parts on the lower levels (now merged into the higher level) can then be deleted from disk. During normal operation, the master part typically accounts for >90% of the active documents in the given partition (100% when everything is fully merged into the master part) and the levels below for the other ~10%."
When AV gets involved, these low level Index files get locked - at times temporarily and sometimes indefinitely (until the noderunner.exe gets recycled) leading to longer than expected processing times (read: poor performance) and/or degraded components.
For example, exceptions such as the following commonly (but not always) occurs when AV locks out a file needed by Search:
NodeRunnerIndex10-bc8226eb-4f3e Search Search Component ajkma Unexpected
JournalReceiverWorker[SPae590e863ac2]: Generation redo failed with exception.:
System.IO.IOException: The process cannot access the file because it is being used by another process. at System.IO.__Error.WinIOError(Int32 errorCode, String maybeFullPath)
at System.IO.File.InternalMove(String sourceFileName, String destFileName, Boolean checkHost)
at Microsoft.Ceres.CoreServices.Storage.LocalDisk.LocalDiskStorage.MoveFile(StoragePath oldPath, StoragePath newPath)
…etc…
In this particular scenario, one of the Journal files were locked out preventing the secondary replica from fully synchronizing with the primary replica. Eventually, this caused the secondary replica to get "left behind" by the primary replica where the problem manifested itself as a degraded Index component.
Keep in mind a few points here:
- The index has lots of different types of files that can be impacted (e.g. Journal files, mfs files, parts, merges, generation state files, and so on) and the exception can happen with any of them. Being said, when hunting in ULS, search for the exception (i.e. "it is being used by another process") rather than this specific event ID.
- This exception does not always occur (so "no message" does not mean "no interference from AV"). But if it does appear in your ULS, AV is most certainly at play (and Process Monitor can help verify).
- With the redundancy built into Search, a single degraded component does not result in any sort of query outage meaning the failure may "silently" occur. In this specific scenario, the customer noticed the degraded components several hours after this event occurring in ULS.
- When this specific scenario occurred, the thread in this Index component was blocked from moving forward and thus stuck on a particular Generation. On a recycle of the noderunner.exe process (by restarting the HostController service), this secondary replica could then be re-seeded and caught up.
As noted above, the "used by another process" exception does not always occur. In other times, we may also see excessively long operations that simply time out. For example:
NodeRunnerIndex10-bc8226eb-4f3e Search General ainw9 Medium
Remote service invocation: method=GetRecoveryAction(lastPreparedGeneration) Service = {
Implementation type=Microsoft.Ceres.SearchCore.JournalShipper.JournalShipper Component: SPd9a8b223b429I.2.0.JournalShipper
Exposer Name: JournalStreamControl
} terminated with exception:
System.Threading.ThreadInterruptedException: Thread was interrupted from a waiting state.
at System.Threading.Monitor.Enter(Object obj)
at Microsoft.Ceres.SearchCore.Journal.Journal.get_LastPreparedGeneration()
at Microsoft.Ceres.SearchCore.JournalShipper.JournalShipper.GetRecoveryAction(UniqueGeneration generationId)
Followed by:
NodeRunnerIndex10-bc8226eb-4f3e Search Search Platform Services ajhl2 Monitorable
Microsoft.Ceres.CoreServices.Remoting.InvokerService : Service invocation timed out after 179999 ms,
method=GetRecoveryAction(lastPreparedGeneration) Service = {
Implementation type=Microsoft.Ceres.SearchCore.JournalShipper.JournalShipper
Component: SPd9a8b223b429I.2.0.JournalShipper
Exposer Name: JournalStreamControl
}
If you're actually still reading at this point, the 179 seconds reported in the timeout should trigger memories of a "Content Processing Activity" chart above where the average time was ~170 seconds (aka: the wall of yellow).
The takeaway...
If you see anything like this:
Be thinking...
- Verify AV exclusions /* this is by far the most typical root cause that I've seen */
- Check for failing Master Merge
- Disable TCP Chimney Offload and IP Task Offload /* rare, but it can make an impact */
- And then dive into the other typical resources constraints (e.g. Disk, Network, CPU)
I hope this helps...
Comments
- Anonymous
May 25, 2016
Thank you very much.This is a great sample of how one can explain a complicate issue using just enough details and graphic. Wonder if your blog has a feed we can subscribe to?
