Getting the most out of the new scenario views
What is the scenario view, and why do I want to use this?
With the release of StatsMan 1.1, the scenario view was introduced. This is a view that is tailored to show you a huge amount of data in a small space, especially useful for certain scenarios, hence the name!
How do I use it?
In the drop down menu near the top of the StatsMan homepage, you'll find the Scenario menu, preloaded with several scenarios we think you'll find useful. Most of the scenario views are tailored to view a single pool in your infrastructure, with the exception of the Pool Failover scenario, where you'll look at a pair of pools side by side for easy comparison.
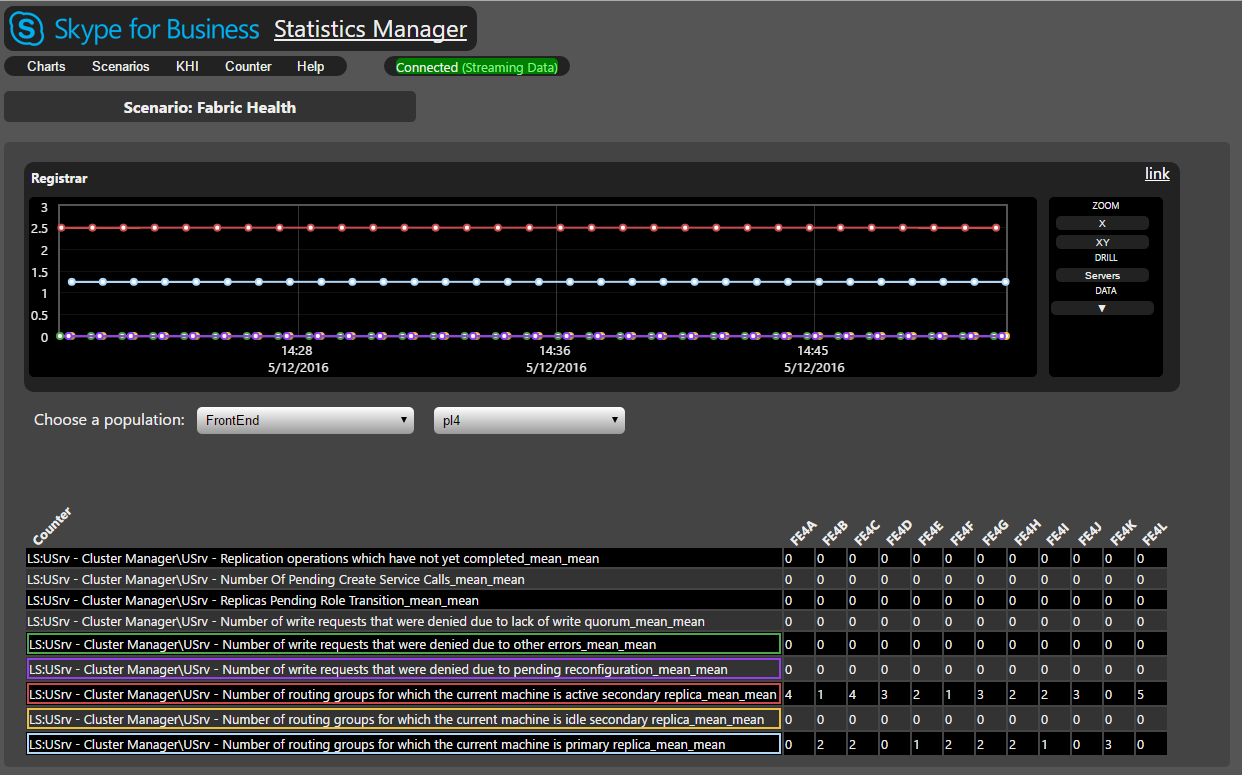
Choose one of the scenario views to get started. Note that the pool type will be pre-populated based on the scenario you're working with, allowing you to pick from pools that make the most sense for this scenario. Choose a pool to view the statistics for it. The statistics in the table will continue updating in real-time as long as the page is open.
Once the data is populated in the table, you'll notice that the chart area will remain blank. You have a couple of options here. You can click individual cells in the table to add data series to the chart to see their history, or you can click on the name of the counter to view the history of the average value for that counter for the entire pool. You can add and remove as many counters as you wish.
Extra Credit
- To save space, values with too many digits in the table are compacted via rounding or scientific notation. Mouse over any cell to see the exact value.
- Click once to add a data series to the chart. Click again to remove a data series.
- Shift-Click on a cell that's already added to the chart to highlight that data series on the chart.
- The control panel on the right side of the page still works on this page for any open charts - you can modify how much data history is shown on the page chart(s). By default, 30 data points will be shown.
- Even though a pool type is defaulted in the view, you can view the same statistics for other pool types, just choose a different one, and the list of pools will update to match your new chosen pool type filter.
- After adding some data to the chart, notice the chart link still exists at the top right of the chart. Click it to open the chart in a new window with easy customization via the chart legend.
As always, if you have any questions about this or any StatsMan functionality, drop us a line in the comments or on Twitter @SkypeStatsMan.