Note
Access to this page requires authorization. You can try signing in or changing directories.
Access to this page requires authorization. You can try changing directories.
In this blog post I am going to discuss a very little-known performance metric introduced in SQL Server 2012 that you can use to instantly get a baseline of the query performance for your system. The counters I'm referring to are under the Performance Monitor (perfmon) group SQLServer:Batch Resp Statistics (this name may be slightly different if you have a named SQL Server instance). What this set of counters represent is the count and duration of batches that have completed since SQL Server was last restarted. This allows you to keep track of what your workload looks like on your system for a given snapshot and even for trending over time. Let's look at how we can make use of these useful counters.
First, open perfmon on machine that is hosting the SQL Server service.

Navigate to the SQLServer:Batch Resp Statistics counter group. Notice that there are quite a few different counters under this group. Each counter represents a range, in milliseconds, for batch duration. The ranges are pre-determined – you can't modify them. But, that shouldn't matter too much as they are quite granular. These are metrics for batches that have successfully completed and the values they represent are aggregated over time.

Each counter has 4 different metrics (Instances in Perfmon terms) associated with it (which I borrowed from MSDN). What I am particularly interested in this case are the last two – Elapsed Time: Requests and Elapsed Time: Total (ms). I can use these two metrics for finding the average duration of batches for each counter – which will give me a pretty handy baseline for my system.

For my test, I've restarted my SQL Server and ran a few small queries so some data would show up in perfmon. I've also written an expensive query that I will run a few times to illustrate how the counters will increase. The query I am using the show the jump takes, on average, around 22 seconds to execute on my test VM. Here is the query:
[sql] SELECT ROW_NUMBER() OVER (ORDER BY NEWID()) FROM master..spt_values a, master..spt_values b WHERE a.type = 'P' AND b.type = 'P' AND a.number < 1500 AND b.number < 1500 [/sql]
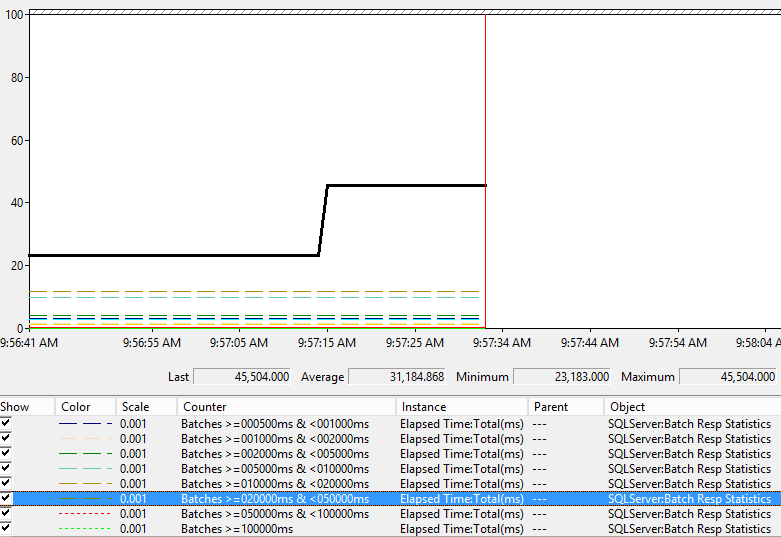
I had my perfmon capture running when I executed the statement above (which happened to be the 2nd time I had executed it). Notice the spike in ElapsedTime:Total(ms) for the Batches >= 20s and Batches <50s counter (I converted milliseconds to seconds because I'm lazy ).
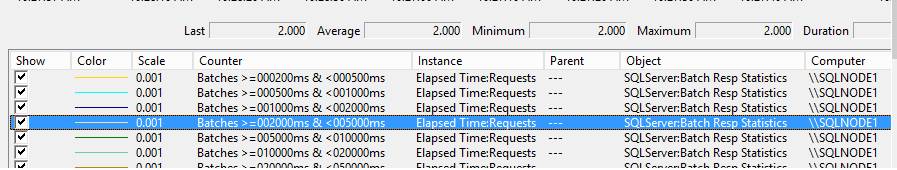
And if I look at the Elapsed Time: Requests instance of the same counter I can see that I have had 2 executions of batches between 20 and 50 seconds.
So, this is great for capturing data and viewing it in perfmon. But, what is REALLY handy is querying the sys.dm_os_performance_counters DMV so I can instantly see what my system baseline is at a given point in time. These numbers should stay relatively stable unless you are experiencing some type of performance issue – which would be a good way to point you in a certain direction to do additional troubleshooting.
[sql]
IF OBJECT_ID('tempdb..#BatchResponses') IS NOT NULL
DROP TABLE #BatchResponses
GO
SELECT *
INTO #BatchResponses
FROM sys.dm_os_performance_counters
WHERE object_name LIKE '%Batch Resp Statistics%'
AND instance_name IN('Elapsed Time:Requests','Elapsed Time:Total(ms)')
GO
SELECT
AvgRunTimeMS = CASE WHEN bcount.cntr_value = 0 THEN 0 ELSE btime.cntr_value/bcount.cntr_value END ,
StatementCount = CAST(bcount.cntr_value AS BIGINT),bcount.counter_name, TotalElapsedTimeMS = btime.cntr_value,
ExecutionTimePercent = CAST((100.0 * btime.cntr_value/SUM (btime.cntr_value) OVER()) AS DECIMAL(5,2)),
ExecutionCountPercent = CAST((100.0 * bcount.cntr_value/SUM (bcount.cntr_value) OVER()) AS DECIMAL(5,2))
FROM
(
SELECT *
FROM #BatchResponses
WHERE instance_name = 'Elapsed Time:Requests'
) bcount
JOIN
(
SELECT *
FROM #BatchResponses
WHERE instance_name = 'Elapsed Time:Total(ms)'
) btime ON bcount.counter_name = btime.counter_name
ORDER BY bcount.counter_name ASC
[/sql]
After running the above query, I see the following output. I can see that 82.64% of the batches executed on my system are between 0 and 1 ms. Again, this is since my SQL Server has been last restarted. I can also see that just over 56% of the time spent executing queries on my system has been for queries that have taken between 20 and 50 seconds to execute. I'm also able to calculate that the average for these executions is right at 22.75 seconds (the AvgRunTimeMS column). So, this may be a situation, if this was a production-level OLTP system, for me to look at the queries on my system that are matching up to that range and see if I can tune them so they aren't so expensive. But – that would completely depend on my workload and what my system needs to be doing.

This is a very useful tool, and one that if you were to trend over time, would be a great baseline for your system so you could know not only its overall footprint, but also be able to easily identify when performance is starting to wane and take corrective actions before it really becomes a problem. Keep in mind that the type and number of batches executed can vary greatly and a change in your baseline may be due to a different query profile (more longer queries executed for example) and not that all queries are running slower. So, this is not a replacement for application metrics, but will may help you realize that something has changed and point you in the right direction to start performance troubleshooting analysis.
Happy Query Tuning!
Thanks,
Tim