Note
Access to this page requires authorization. You can try signing in or changing directories.
Access to this page requires authorization. You can try changing directories.
NOTE: This blog post describes an early Technical Preview of Power BI reports running on SQL Server Reporting Services’s on-premises report server platform. In June 2017, we brought this technology to market as Power BI Report Server. For more info, check out A closer look at Power BI Report Server.
In today’s post, we’re picking up where we left off yesterday with the announcement of the availability of the new Technical Preview of Power BI reports in SQL Server Reporting Services.
- Get it now in the Azure Marketplace
Let’s jump into some basic scenarios that are supported in the technical preview with Power BI reports.
How to create and save a Power BI report to Reporting Services
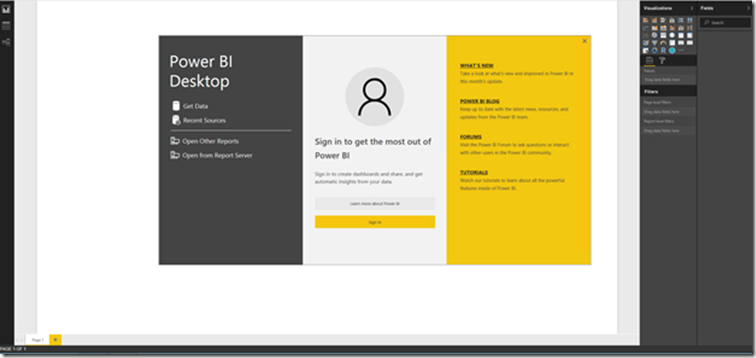
To create a new report, double-click on the Power BI Desktop icon on the desktop of your virtual machine. Please keep in mind the preview only supports using the version of Power BI Desktop installed directly on the VM.
Currently, you are limited to creating a Power BI report against reports that connect live to Analysis Services (Tabular or Multidimensional) and publish it to Reporting Services. We plan on adding support for other data sources and using Power Query features in a future preview.
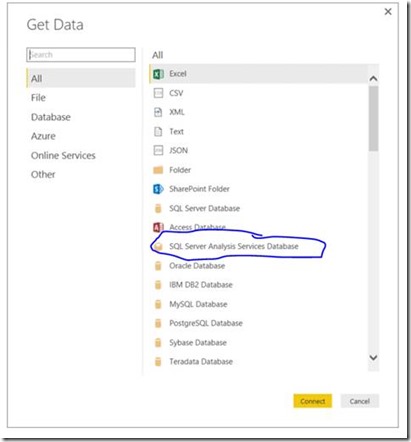
To connect to one of the existing sample data sources on the server, click on ‘Get Data’. Choose SQL Server Analysis Services from the data source options and click Connect.
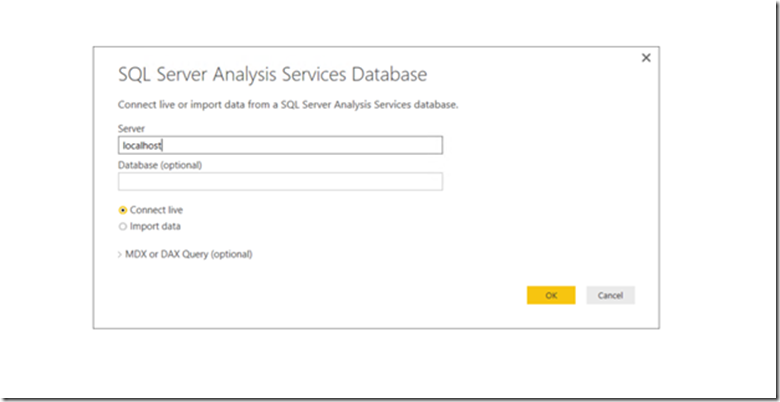
When the pop-up menu appears, enter ‘localhost’ in the Server field and hit OK. Do NOT change the option currently marked ‘Connect live’, as you will then be unable to save your report to the server when you are finished creating it.
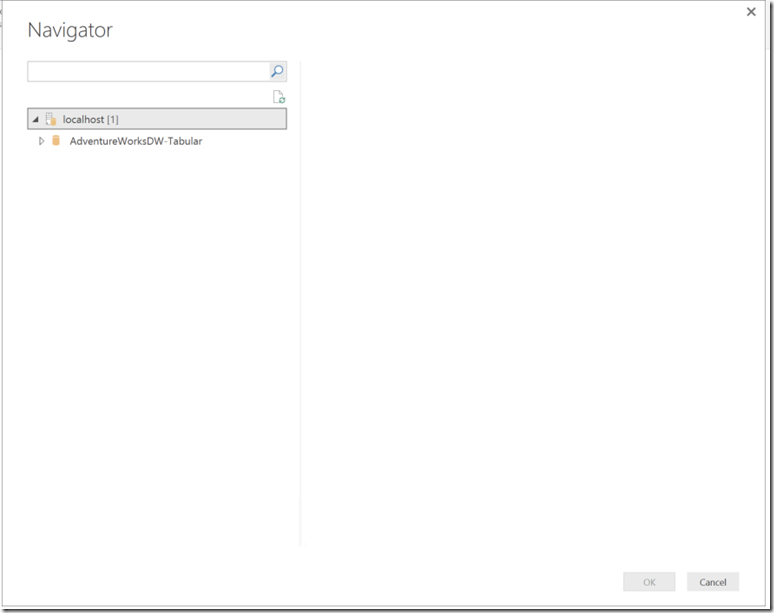
You will see a sample data source available to use for your report, in addition to any Analysis Services data models you have loaded as well.
Select one of your data sources, click OK, and you may now begin creating your report. If you have never created a Power BI report before, I strongly recommend checking out the Power BI Desktop Getting Started Guide.
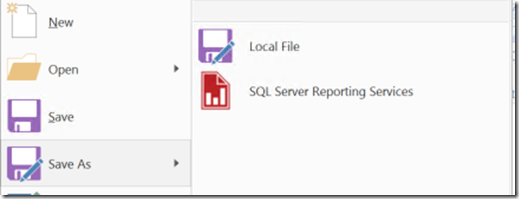
Once you have finished creating your report, go to the File menu and choose “Save As” to save the report. You will have the option to save the report locally, or to save to an instance of SQL Server Reporting Services.
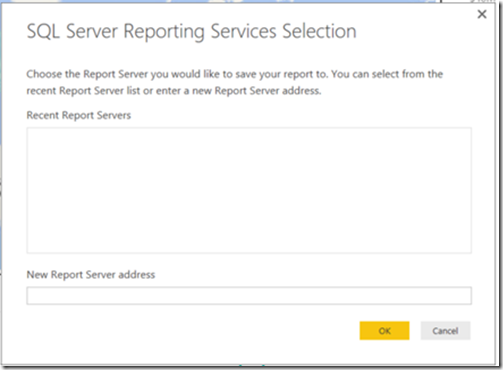
Select SQL Server Reporting Services, and you’ll be presented with a new pop-up window:
Here, you need to enter the Reporting Services web portal URL – the format is the same as what you used to access the web portal through the web browser.
After hitting OK, you can name and save the file to server. If you have created any folders, you can navigate through them here as well.
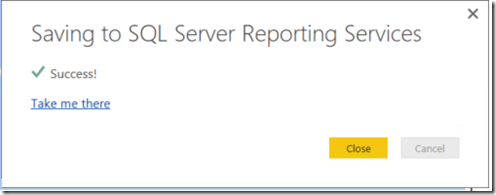
After completing the save, a message will appear showing you have successfully saved your report to the server. Clicking the “Take me there” link will open the report in your browser where you can interact with your report.
How to open/save a Power BI report from Reporting Services
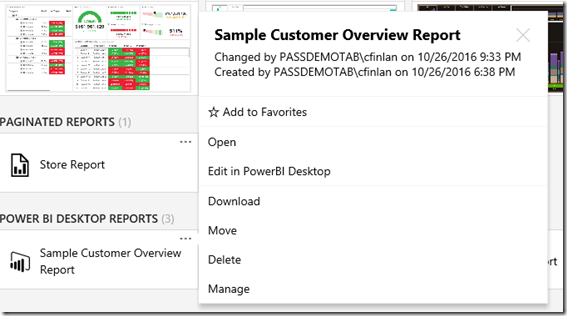
From the Reporting Services web portal on your VM, click the "…" button in the right-hand corner of the Power BI report you wish to edit. The new context menu will appear with several options. Select ‘Edit in Power BI Desktop’ to launch the local Power BI Desktop on the VM so you can edit your file.
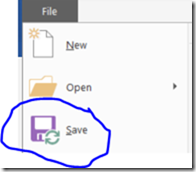
When you are finished editing, simply select Save in the File menu or in the toolbar to save your changes back to the server. The green “Connected” icon is present, which lets us know it is already connected to a Reporting Services instance.
Adding Comments to your Power BI reports
Another new feature we’ve added is the ability to add and view comments about a report you’re viewing, including Power BI reports.
By default, any user who has Browser permissions or higher for a report will be able to add new comments, in addition to being able to edit or delete their own comments. They can also reply to other users' comments. Content Managers will also be able to delete other users' comments, or disable comments for users on an existing report.
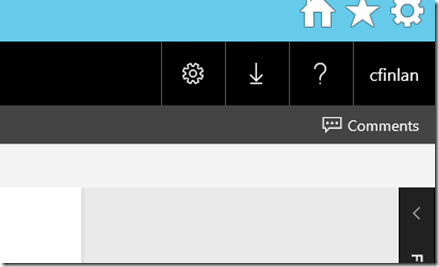
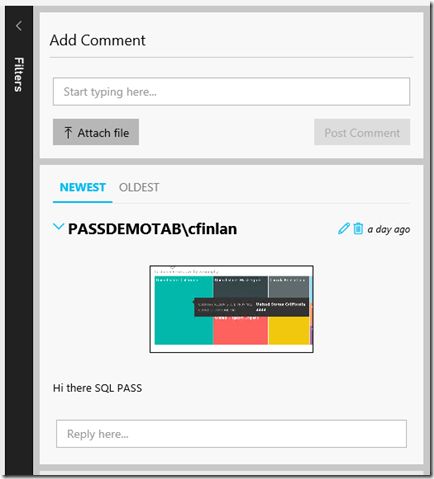
To add a new comment, click the Comments button on any report page to expand the Comments pane:
Once expanded, you can enter your comment in the text box and click Post Comment to save. Your comment will be added at the top of the comment thread by default. In addition, you can add attachments to any comment you create. This is a helpful way to include the state of the report at the time you left your comment. The attachment can be either an image file type or a PDF. Simply select the “Attach File” button when you’re adding a new comment to include your attachment. If it is an image file, you will have a small thumbnail of the file appear that you can select to view the image at full size.
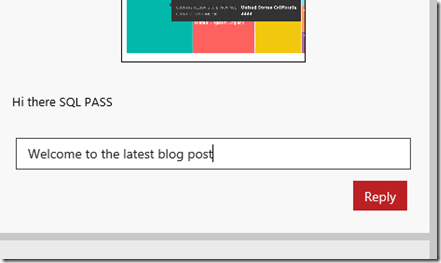
To reply to an existing comment another user has left, you can enter text in the area below an existing comment and click the Reply button.
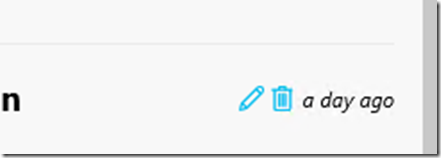
You can also edit and delete your own comments by using the edit/delete icons next to each comment you have left.
Try it now and send us your feedback
One of the reasons we provided this early technical preview was to get your feedback – what you like, don’t like, what you’re hoping to see in the product, and anything else you’re curious about. To help facilitate that communication directly with the product team, we have set up a special e-mail address that directs your feedback to the entire Reporting Services product team. We can’t guarantee we’ll be able to respond to every piece of feedback personally, but it will definitely help us shape the product as we move forward with subsequent previews.
- Get the Technical Preview from the Azure Marketplace
- Post in the Reporting Services forum (or if you prefer, send us an email)
- Join the conversation on Twitter: @SQLServerBI, #SSRS
Comments
- Anonymous
October 29, 2016
Thanks for the details on this technical preview. I seem to have used up my free azure trial and now I'm being prompted to provision a VM via a subscription. The least expensive VM for this is $245/month. Is that how much I'll be billed to try out this technical preview? Any way you can provide a direct link to a vhd image we cab download for an offline preview?- Anonymous
October 29, 2016
We aren't providing a direct link to a vhd as there are a number of items provisioned dynamically when you create the image. You are welcome to download the vhd from the image you spin up (http://christopherfinlan.com/2016/10/29/how-to-run-the-technical-preview-of-power-bi-reports-in-sql-server-reporting-services-on-prem-using-hyper-v) and then simply delete it from your subscription. In addition, you can try it as needed and simply turn off the VM when you aren't using it so you aren't charged, which is what we fully expect most people to do. Thanks for your question!- Anonymous
November 01, 2016
That's helpful, thanks! Do you know how much one would be charged for this - provision VM, download the disk image, then delete the VM from subscription? Would that result in a single month payment?- Anonymous
November 03, 2016
Hi Michael, No, you are only charged for the time the VM is running and any storage you have on a daily basis. So to spin it up for a few hours, download the vhd, and then delete everything, you're looking at much less than a full month payment. Again, the VM cost for the recommended size is 55 cents an hour or something quite small, so you really aren't paying much at all.That being said, I recommend using it in Azure and simply stopping it when you aren't using it, simply because that's what the experience was optimized for. Running on hyper-V on a Win10 laptop is going to be slower than what you'll get with the Azure VM. Either way, have fun with it and less us know what you think.
- Anonymous
- Anonymous
- Anonymous
- Anonymous
November 02, 2016
Quick question! Is there the availability to create the dashboard view by pinning tiles from several reports into the same dashboard? I am not able to find that feature and I know it is a prominent feature in Power BI services which is cloud based. Will/Is this available on premise too?- Anonymous
November 02, 2016
For the short term, we're focusing on Power BI reports and not on various other Power BI features, such as "dashboards" and Q&A. We’ve made great progress for Power BI reports, as you can now see in the Technical Preview, and at the same time we know we have more work to do (support for custom visuals, other data sources via Power Query, etc.)- Anonymous
November 02, 2016
Yes, the Technical Preview is phenomenal to say the least! I am in the midst of trying everything out and seeing how it meets our needs as an on-prem option for reporting. I am very excited to see how it develops and grows. Is there by chance a timeline/roadmap for what will be added going forward? (e.g. "dashboards", Q&A, adding other data sources (on-prem SQL Server), etc.) Also, thank you for the clarification and your quick response! As mentioned, I am excited to see how it develops over the next few months or so. Great work!- Anonymous
November 03, 2016
Thanks, Kelsey! While we don't have specific dates to share, some notable things (not an exhaustive list) on our short-term roadmap include- A preview you can download and install "clean" (we're actively working on it)- Support for custom visuals- Support for direct connectivity to data sources other than Analysis Services- Support for Power Query data transformationsWith our focus on Power BI reports, our short-term roadmap excludes "dashboards" and Q&A.
- Anonymous
- Anonymous
- Anonymous
- Anonymous
November 03, 2016
Hello to the SSRS team,My Customer (a Biotechnology company) and I are waiting for General Availability of the PBI and SSRS breathless.We've installed the VHD on the Hyper-V and testing it.When trying to save the PBI report to the SSRS (http://localhost/reports) we are getting an error saying:"Sorry, you don't have permissions to save in this folder. Please choose a different folder and try again"I'm logged in as the admin of the server.Please advice.Thanks in advance- Anonymous
November 03, 2016
The comment has been removed
- Anonymous
- Anonymous
November 17, 2016
Is this feature going to be part of SQL 2016 updates or Power BI ?- Anonymous
November 17, 2016
We'll be releasing this feature in a future release vehicle (not in SQL Server 2016 servicing updates).
- Anonymous
- Anonymous
November 21, 2016
Hello,I am French, please excuse me for my bad English.I try to use powerbi and to save my report on the SSRS but I have no button to save as "SQL Server Reporting Services" in the menu.How to obtain it?Thanks- Anonymous
November 21, 2016
With this Technical Preview, you need to use the version of Power BI Desktop pre-installed on the VM.- Anonymous
November 22, 2016
I owed installed the new version: 2.40.4554.463 64 - bit (October on 2016) because my report made with this version.How then I to reinstall the supplied version preinstalled with the VM?- Anonymous
November 28, 2016
This first Technical Preview is intended to be a sandbox with everything on the VM itself, so this version of Power BI Desktop isn't available outside of the VM. We're hard at work on the next step - a preview you can install on your own VM or server, with a version of Desktop you can install and use on a separate machine if you like.
- Anonymous
- Anonymous
- Anonymous
- Anonymous
November 22, 2016
Hello,I have been testing the on premise version on Azure now. Everything looks very promising. My client has a need for on premise installation and in order to get the most out of the system the embedded features currently available in Azure with Power BI Embedded would be ideal. Is there a roadmap to bring this available with the on-premise version as well?- Anonymous
November 28, 2016
We do aim to support embedded scenarios and the Technical Preview already supports basic embedding of Power BI reports via the rs:Embed=true URL parameter, while we're in touch with the Power BI Embedded team and exploring how richer programmability might translate to on-premises report servers.
- Anonymous
![clip_image002[6] clip_image002[6]](https://msdntnarchive.z22.web.core.windows.net/media/2016/10/clip_image0026_thumb2.jpg)
![clip_image002[8] clip_image002[8]](https://msdntnarchive.z22.web.core.windows.net/media/2016/10/clip_image0028_thumb.jpg)
![clip_image002[10] clip_image002[10]](https://msdntnarchive.z22.web.core.windows.net/media/2016/10/clip_image00210_thumb1.jpg)
