SCOM - Creating a Visio Dashboard and Publishing to SharePoint
There are a lot of great dashboard capabilities in System Center 2012 R2. In this post I will be walking through the process to create a customized Visio Dashboard that displays the current health state of an Active Directory environment based on the information contained in System Center Operations Manager. I have also attached a copy of the base Visio drawing used in the examples below. I hope this is helpful in providing ideas as to how Visio and SharePoint can be used to display SCOM data in new and useful ways.
This all should work assuming the following pre-requisites are met:
- System Center Operations Manager 2012 R2 is installed.
- SharePoint 2010 or greater is installed (steps below are for SharePoint 2013).
- The Visio Web Part for SharePoint is installed per the following link: https://www.microsoft.com/en-us/download/details.aspx?id=29268|
- Visio 2010 or Greater is installed on your system
- The Visio 2010 Add-in for System Center Operations Manager 2012 is installed per the following link: https://technet.microsoft.com/en-us/library/hh920815.aspx
Steps to Create and Configure a Dashboard:
Create the base Drawing Used for displaying your data, this can contain actual drawings or shapes. Mine is shown here:
![]()
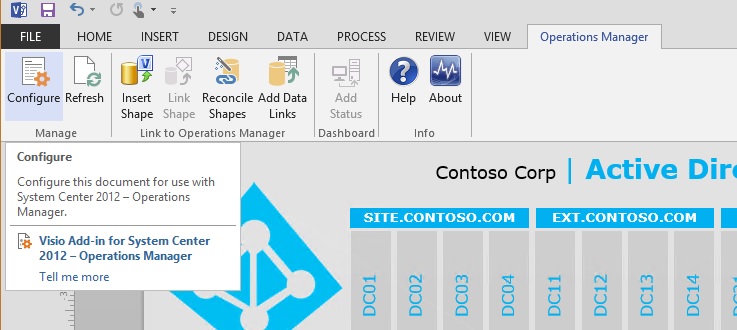
Configure the Data Source to connect to your Management Server and Web Console. To do this, select the 'Operations Manager' Tab on the ribbon in Visio, and click 'Configure'.
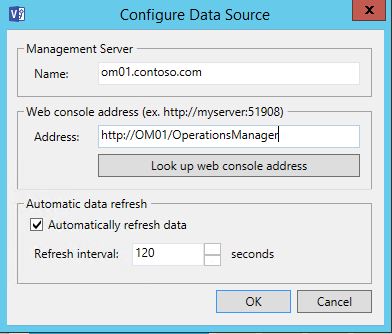
Enter the FQDN of your Management Server and click 'Look up web console address' to ensure that the Management Server is recognized. Select the checkbox for Automatically refresh data and enter the refresh interval.
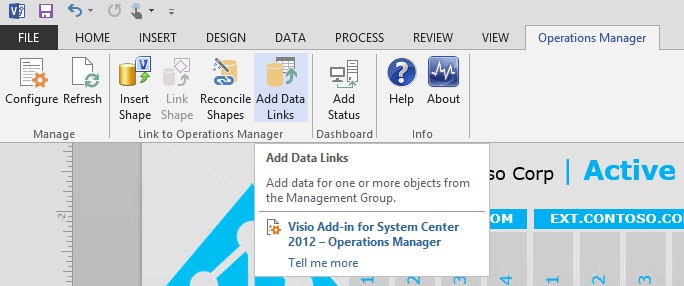
Add Data Links for each object that you want to monitor the state of. This step can take a while depending on the number of objects. In my example we are monitoring Domain Controller Health. For Each Domain Controller I selected nine individual objects. The first and obvious one is 'Windows Computer', This object is a roll up of a large number of things such as availability, performance, etc... To add this Data Link click the 'Operations Manager' tab on the ribbon in Visio and select 'Add Data Links'
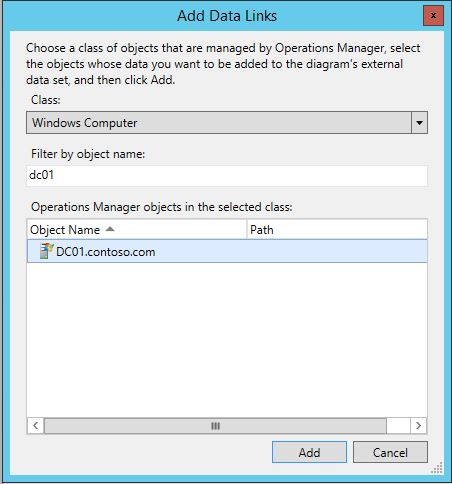
When the Add Data Links prompt appears, select the 'Windows Computer Class', Select the names of each Computer Object you want to monitor in this Dashboards and click 'Add'
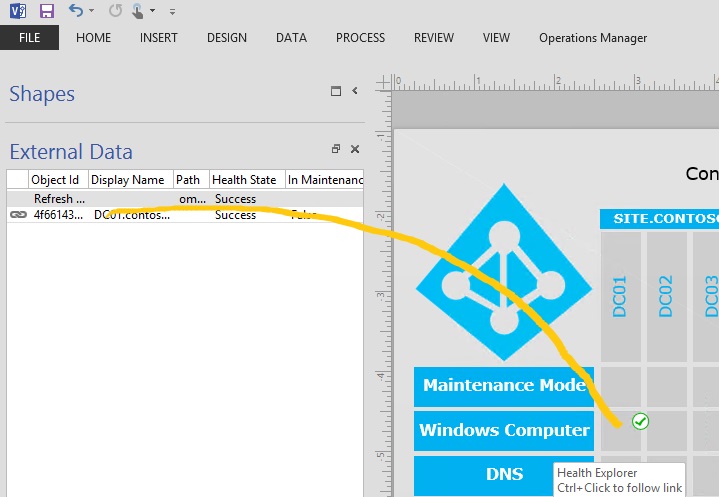
To link this newly added object to a shape in the drawing simply select the object from the External Data box and drag it to the shape where you want to represent the health of that object
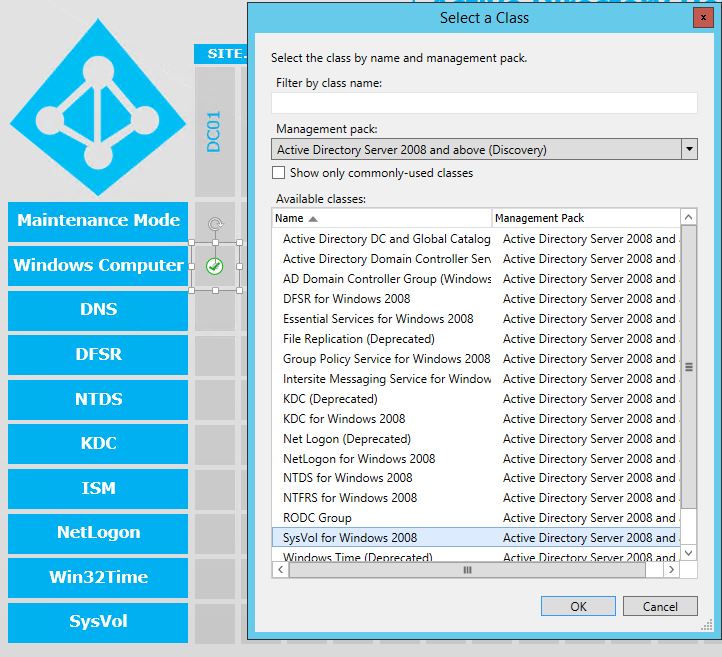
Repeat this process for every class and object that you want to monitor. The majority of the classes in this particular dashboard can be found in the 'Active Directory Server 2008 and above (Discovery)' Management Pack. To see these you will need to select 'Other class...' and uncheck the box for 'Show only commonly-used classes'. Select each class and all objects associated with the objects you want to monitor.
Notice that in my environment the default data graphic automatically put a green check box in the top right corner indicating that the computer object is healthy. This might vary depending on what you have in Visio. I like the green check box, but would prefer that it is centered in the box. To view and edit the data graphics select the objects that you want your changes to apply to in the Visio drawing and click the 'Data' tab on the ribbon.
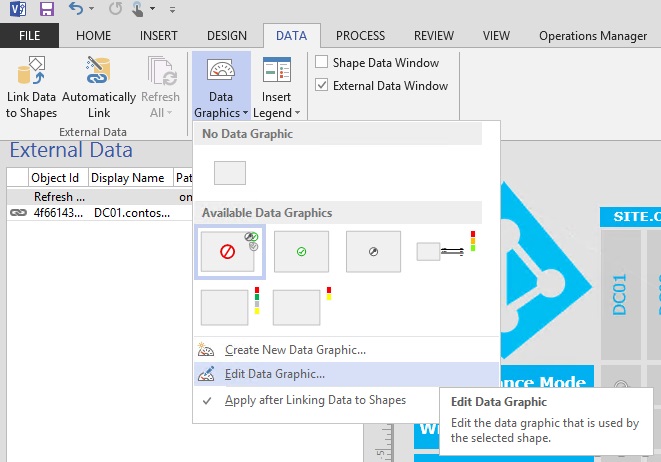
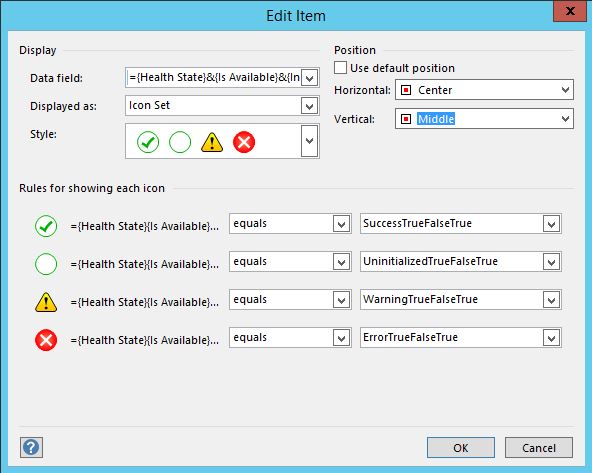
The available data graphics will be shown. You can simple select one of them, create a new data graphic, or edit an existing graphic. Often I use colors instead of icons to indicate health. In this example I will just edit an existing data graphic so that we only see the health icons in the center of the shape. After clicking 'Edit Data Graphic' I deleted all rows except '={Health State}&{Is Available}&{In Maintenance}&{Managed}'.
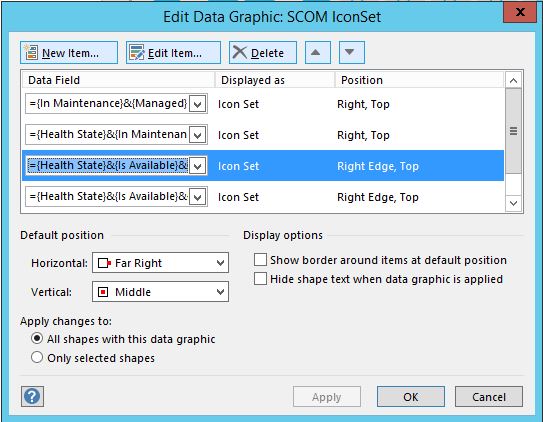
On the remaining row click 'Edit Item', change Horizental to Center and Vertical to Middle.
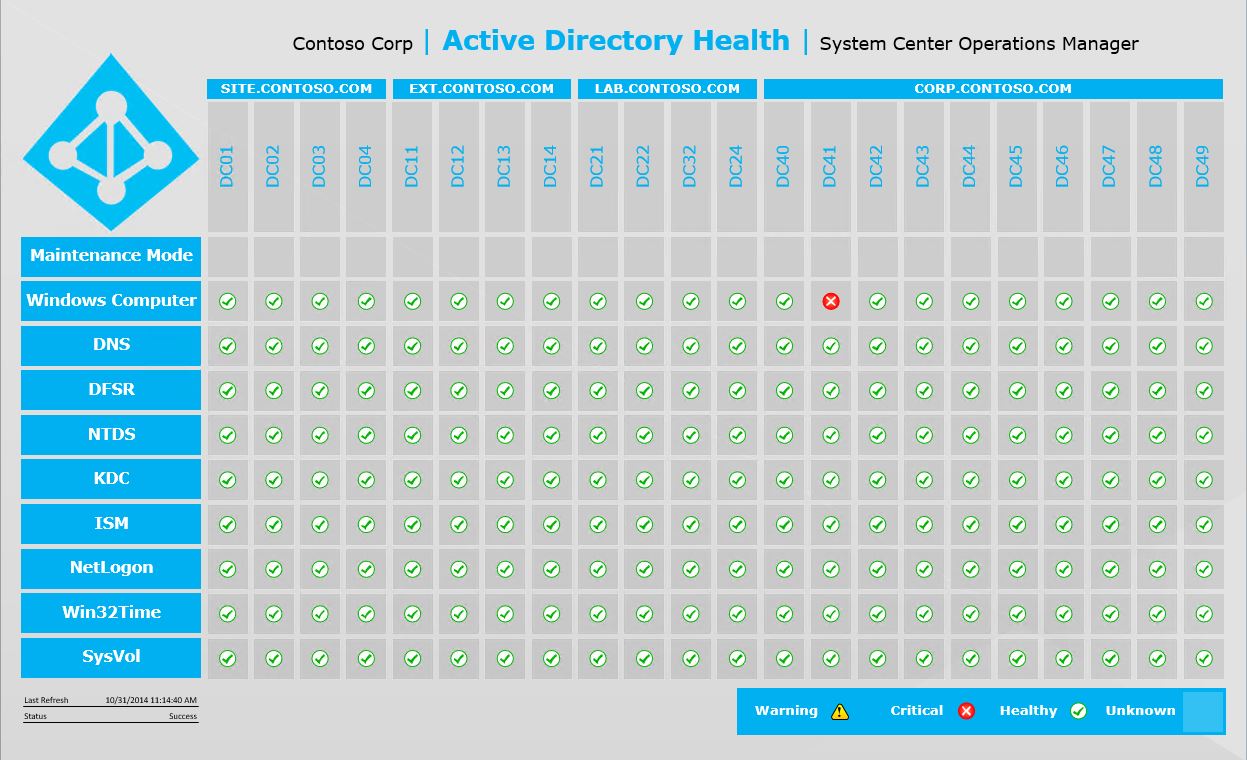
Once you have added all data objects, linked them to their associated objects, and updated the data graphics your dashboard should look something like this.
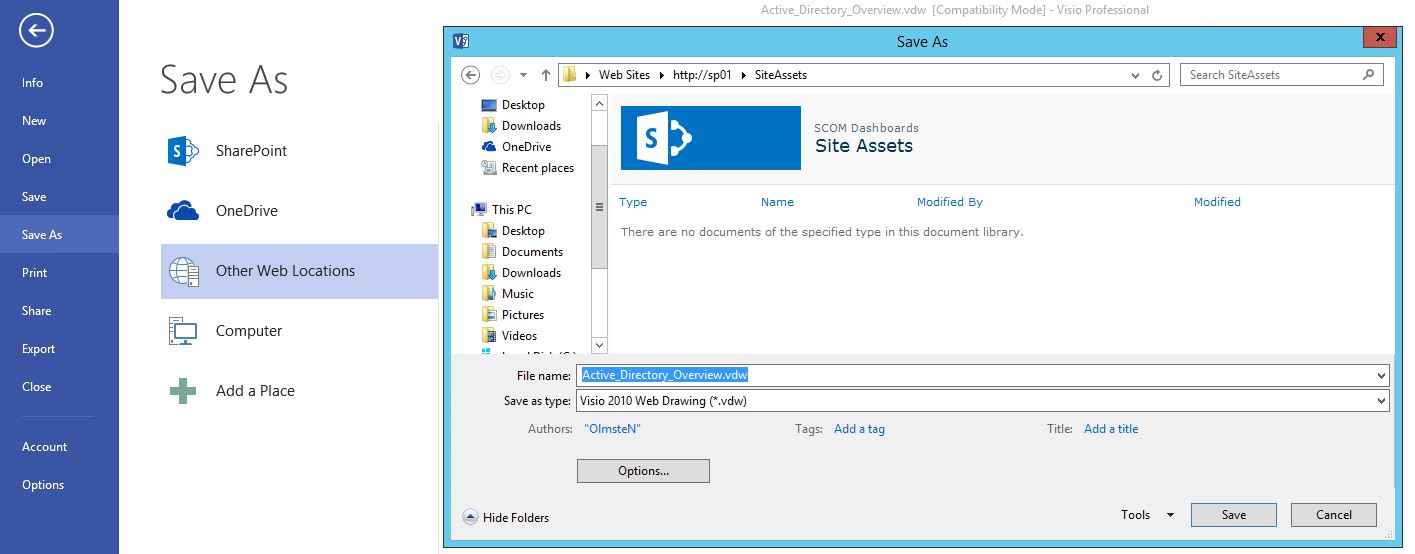
Make sure to save the file as a .vdw (Visio Web Drawing) file. To save to SharePoint either click 'Save and Send' or 'Save As', enter the location of a folder on your sharepoint site.
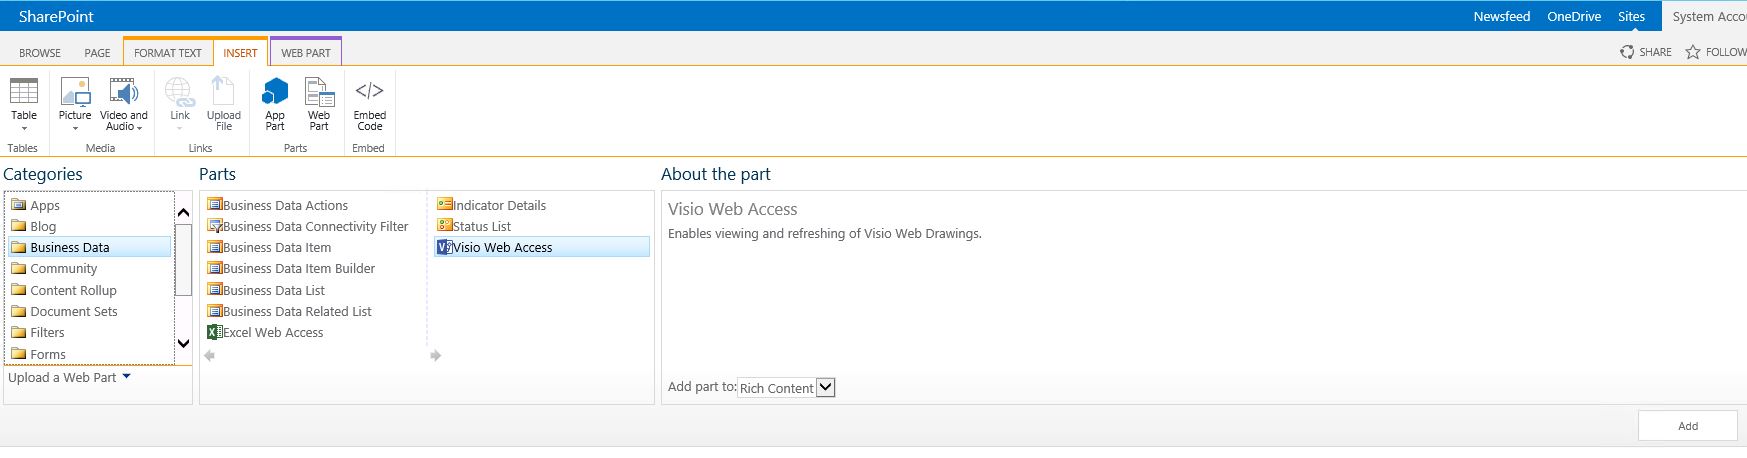
To add the Visio drawing to a SharePoint page. Edit the page, Click Insert > Web Part. Expand 'Business Data' and select 'Visio Web Access'
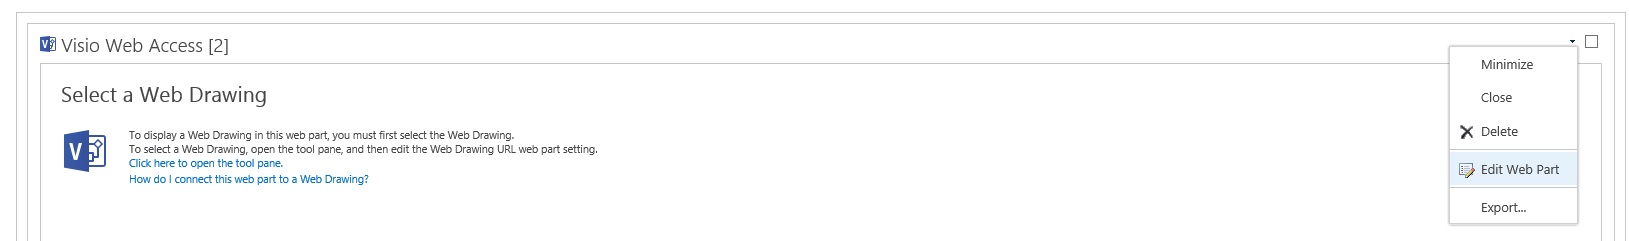
Edit the Web Part
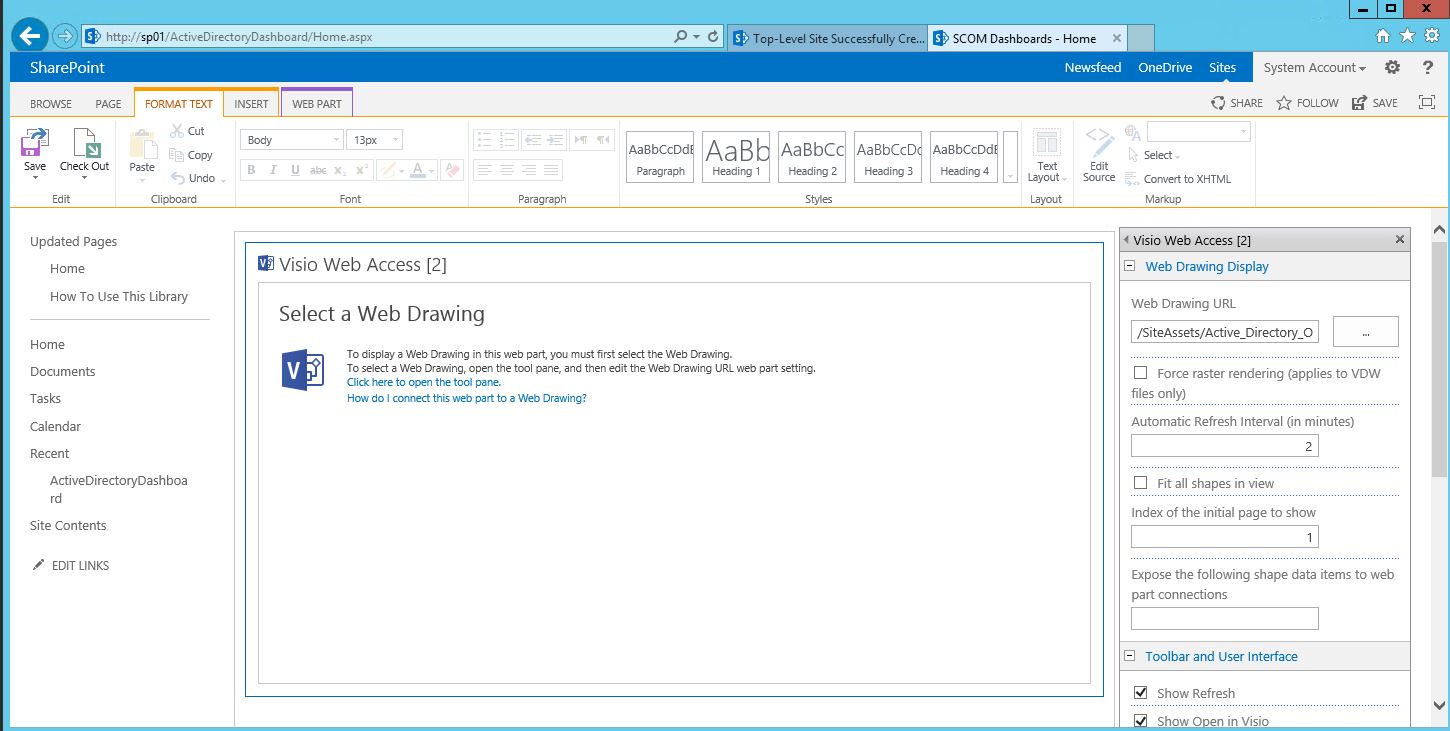
Click the box next to the 'Web Drawing URL' and browse to the location where you earlier saved the .vdw file. Set the refresh rate for the drawing and any other settings required for your drawing and click ok.
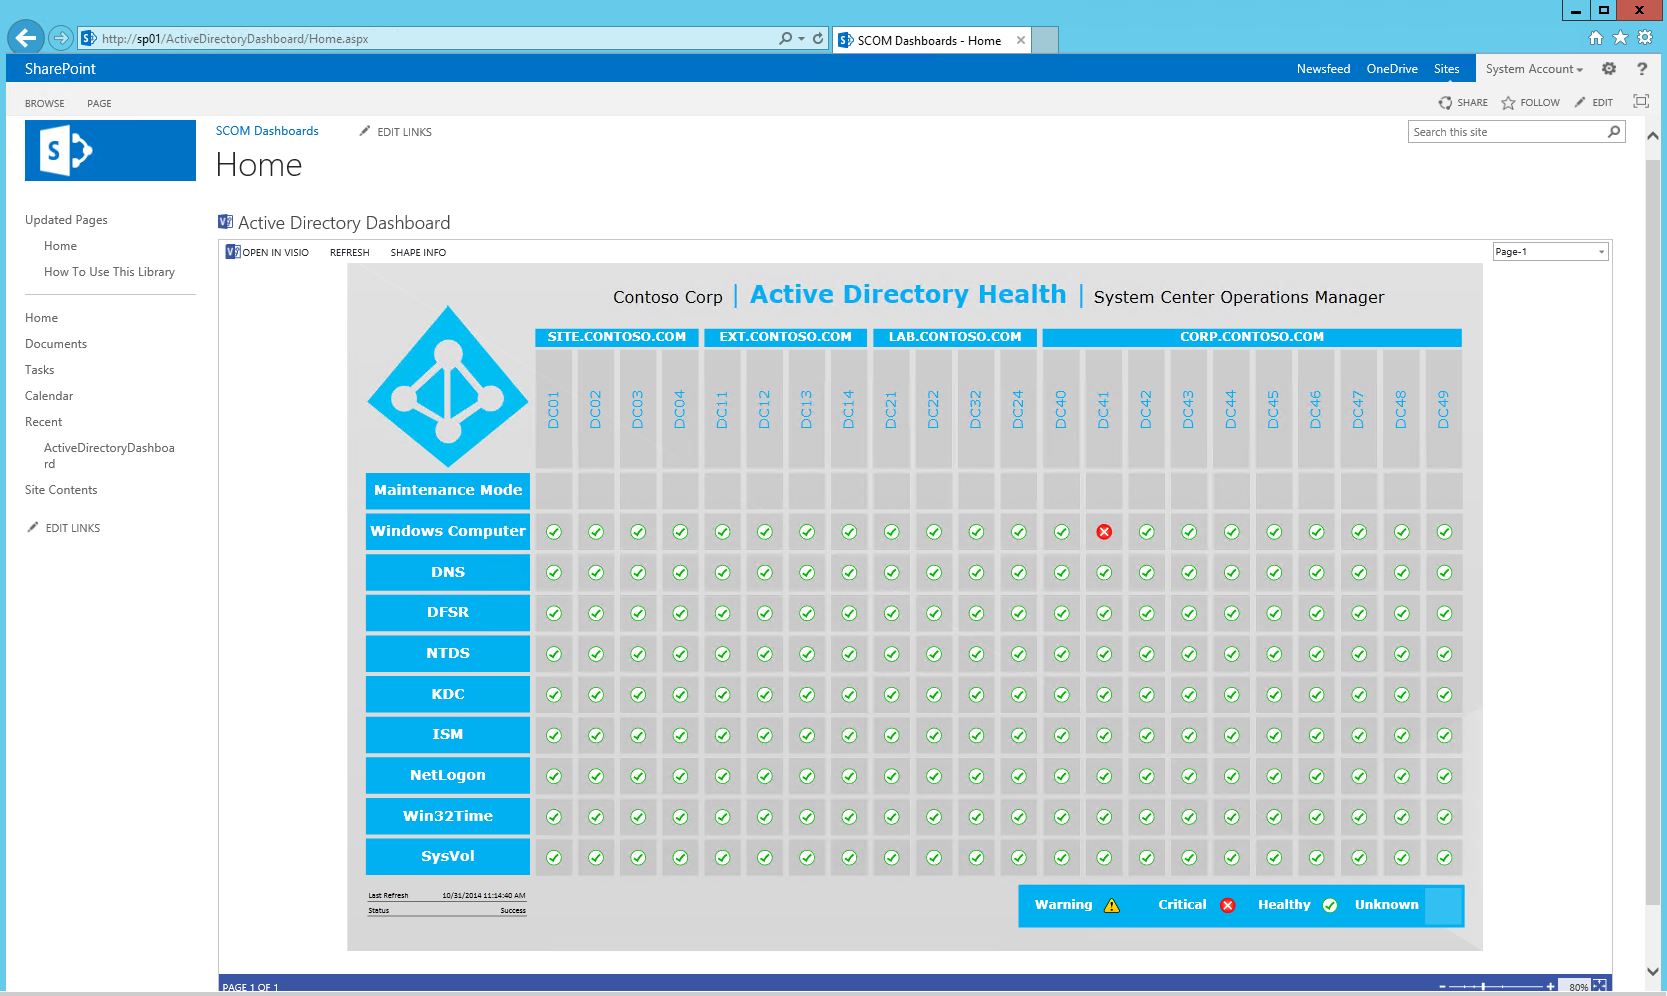
Save the page. The final product should look something like this:
I hope this has been helpful in understanding the types of monitoring data that can be easily displayed in a custom Visio SCOM Dashboard.