Note
Access to this page requires authorization. You can try signing in or changing directories.
Access to this page requires authorization. You can try changing directories.
Carrying on from our workshop post of how to get started with Windows 10 on RapberryPi
I know want to do something meaning full with the data which the Raspberry Fez Hat has been collating about the temp and light.
Microsoft Azure IoT suite offers many different ways to generate meaningful information from the data gathered by the devices.
In this blog I will cover using Azure Stream Analytics in combination with Microsoft Power BI to consume the data and to generate meaningful reports
Using Microsoft Power BI to visualize the data being collated in Azure IoT Hub
One of the most interesting ways to use the information received from the connected device/s is to get near real-time analysis using the Microsoft Power BI tool.
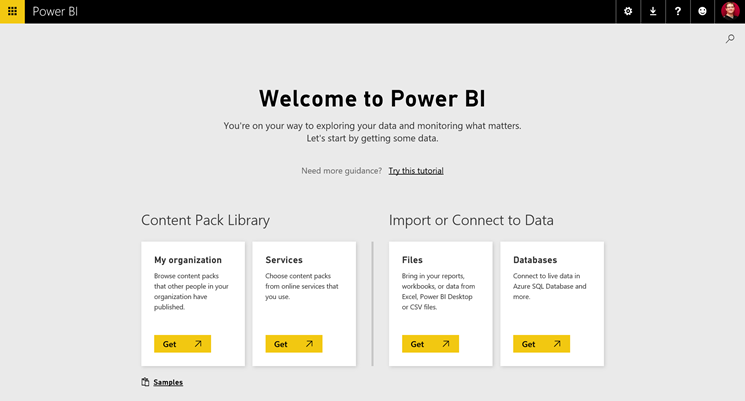
Step1. Setting up Power BI
If you don't have a Power BI account already, you will need to create one (a free account is enough to complete this lab). If you already have an account set you can skip this step.
- Go to the Power BI website and follow the sign-up process.
Now that your account is set, you are ready to set up the data source that will feed the Power BI dashboard.
Step 2. Create a Service Bus Consumer Group in Microsoft Azure
In order to allow several consumer applications to read data from the IoT Hub independently at their own pace a Consumer Group must be configured for each one. If all of the consumer applications (the Device Explorer, Stream Analytics / Power BI, the Web site you will configure in the next section) read the data from the default consumer group, one application will block the others.
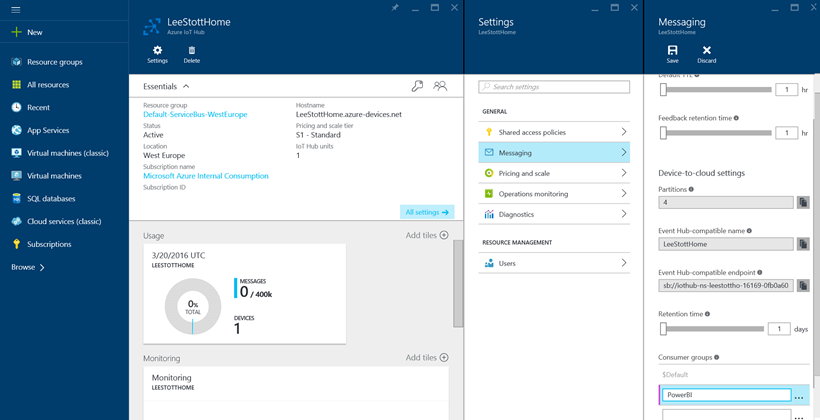
To create a new Consumer Group for the IoT Hub that will be used by the Stream Analytics job you are about to configure, follow these steps:
- Open the Azure Portal (https://portal.azure.com/), and select the IoT Hub you created.
- From the settings blade, click on Messaging
- At the bottom of the Messaging blade, type the name of the new Consumer Group "PowerBI"
- From the top menu, click on the Save icon
Setting the data source
In order to feed the Power BI reports with the information gathered by the hats and to get that information in near real-time, Power BI supports Azure Stream Analytics outputs as data source.
Step3. Configure the Stream Analytics
Before the information can be delivered to Power BI, it must be processed by a Stream Analytics Job. To do so, an input for that job must be provided. As the Raspberry devices are sending information to an IoT Hub, it will be set as the input for the job.
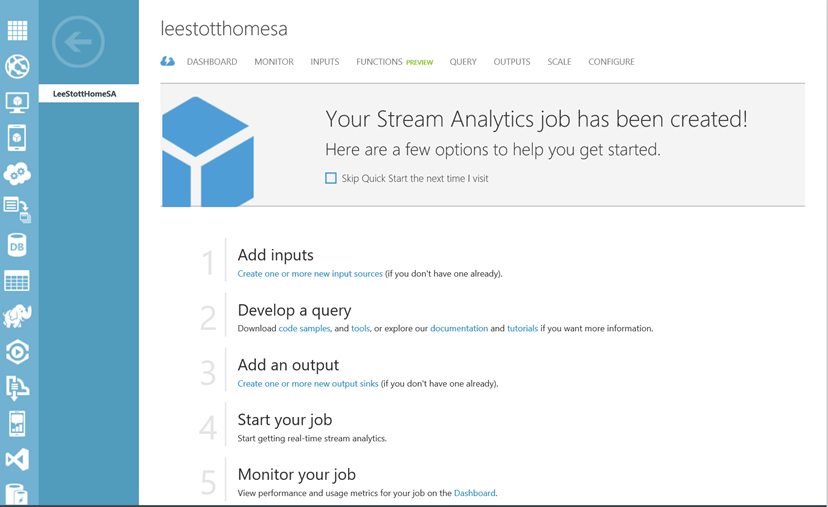
Select Stream Analytics service. from the classic Azure management portal (https://manage.windowsazure.com) and select the Stream Analytics service. There you will find the Stream Analytics job created during the Azure services setup. Click on the job to enter the Stream Analytics configuration screen.
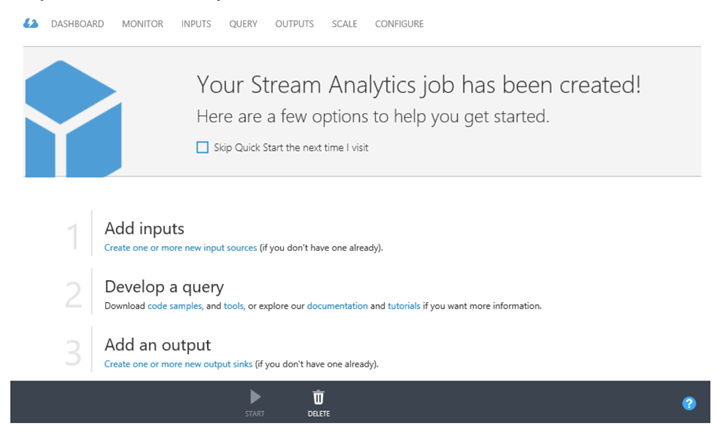
Create a new Stream Analytics Job
As you can see, the Start button is disabled since the job is not configured yet. To set the job input click on the INPUTS tab and then in the Add an input button.
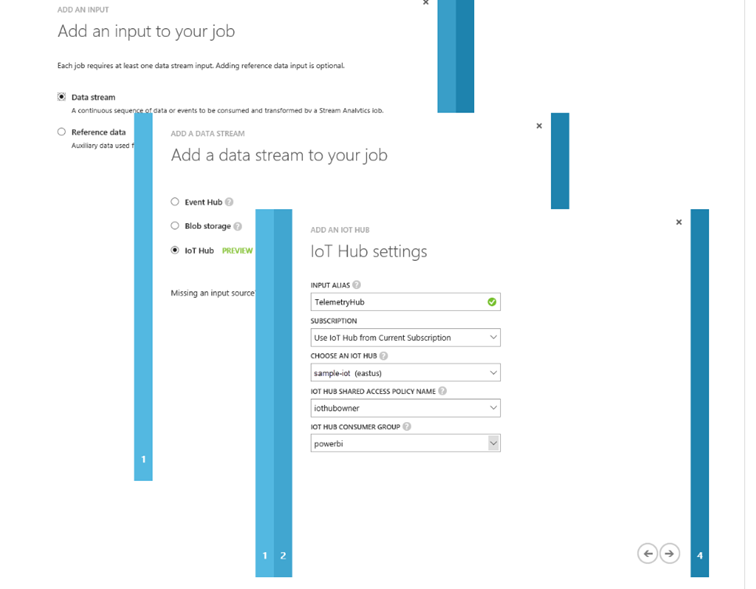
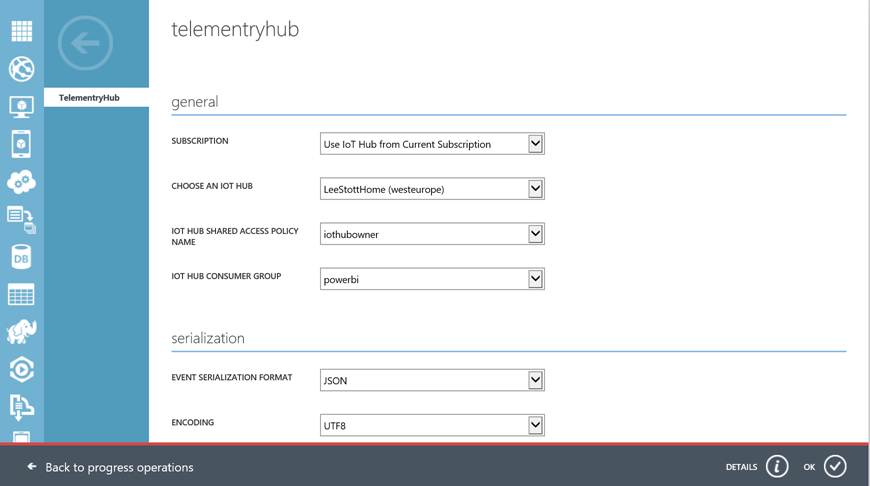
In the Add an input to your job popup, select the Data Stream option and click Next. In the following step, select the option IoT Hub and click Next. Lastly, in the IoT Hub Settings screen, provide the following information:
Stream Analytics Configuration
. Please Note - Power BI output is not yet supported in the Azure Preview portal. Please navigate to the Azure Management portal to use this feature.https://manage.windowsazure.com/
- Input Alias: TelemetryHub
- Subscription: Use IoT Hub from Current Subscription (you can use an Event Hub from another subscription too by selecting the other option)
- Choose an IoT Hub: iot-sample (or the name used during the IoT Hub creation)
- IoT Hub Shared Access Policy Name: iothubowner
- IoT Hub Consumer Group: PowerBI
Stream Analytics Input Configuration
Click Create
Step 4. Stream Analytics Output Setup
The output of the Stream Analytics job will be Power BI.
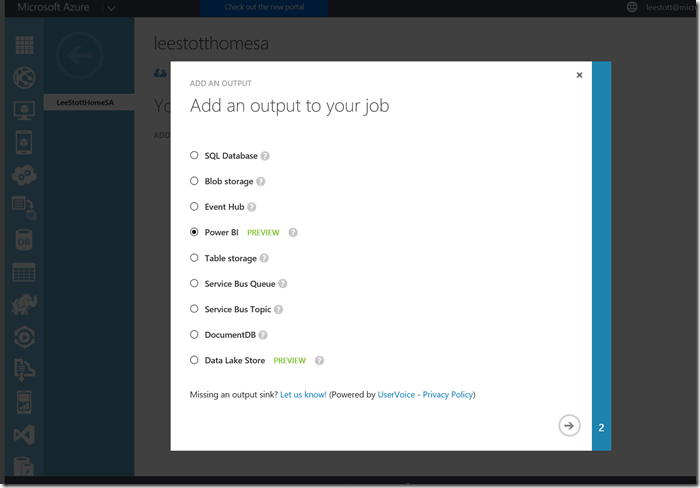
To set up the output, go to the Stream Analytics Job's OUTPUTS tab, and click the ADD AN OUTPUT link.
In the Add an output to your job popup, select the POWER BI option and the click the Next button. Please Note - Power BI output is not yet supported in the Azure Preview portal. Please navigate to the Azure Management portal to use this feature.https://manage.windowsazure.com/
In the following screen you will setup the credentials of your Power BI account in order to allow the job to connect and send data to it. Click the Authorize Now link.
Stream Analytics Output Configuration
You will be redirected to the Microsoft login page.
Enter your Power BI account email and password and click Continue. If the authorization is successful, you will be redirected back to the Microsoft Power BI Settings screen.
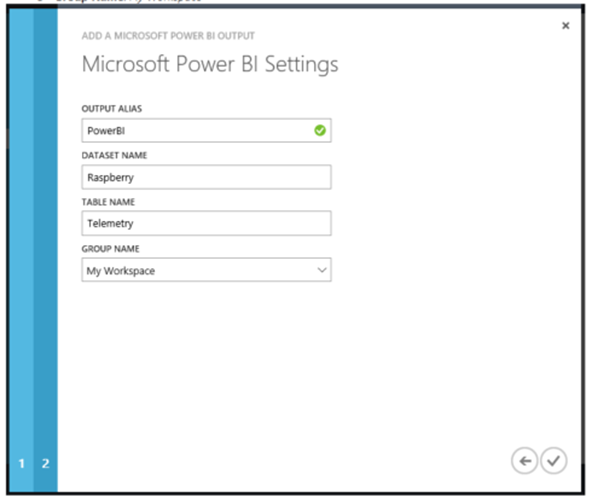
In this screen you will enter the following information:
Power BI Settings
Click the checkmark button to create the output.
Step 5. Adding Stream Analytics
Now that the job's inputs and outputs are already configured, the Stream Analytics Job needs to know how to transform the input data into the output data source. To do so, you will create a new Query.
Go to the Stream Analytics Job QUERY tab and replace the query with the following statement:
 SELECT
    iothub.iothub.connectiondeviceid displayname,
    location,
    guid,
    measurename,
    unitofmeasure,
    Max(timecreated) timecreated,
    Avg(value) AvgValue
INTO
    [PowerBI]
FROM
    [TelemetryHUB] TIMESTAMP by timecreated
GROUP BY
    iothub.iothub.connectiondeviceid, location, guid, measurename, unitofmeasure,
    TumblingWindow(Second, 10)
The query takes the data from the input (using the alias defined when the input was created TelemetryHUB) and inserts into the output (PowerBI, the alias of the output) after grouping it using 10 seconds chunks.
Click on the SAVE button and YES in the confirmation dialog.
Step 6. Starting Stream Analytics
Now that the job is configured, the START button is enabled. Click the button to start the job and then select the JOB START TIME option in the START OUTPUT popup. After clicking OK the job will be started.
Once the job starts it creates the Power BI datasource associated with the given subscription.
Step 7. Setting Up Power BI Dashboard
Now that the datasource is created, go back to your Power BI session, and go to My Workspace by clicking the Power BI link.
After some minutes of the job running you will see that the dataset that you configured as an output for the Job, is now displayed in the Power BI workspace Datasets section.
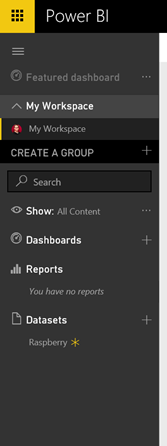
Power BI: New Datasource
Note: The Power BI dataset will only be created if the job is running and if it is receiving data from the IoT Hub input, so check that the Universal App is running and sending data to Azure to ensure that the dataset be created. To check if the Stream Analytics job is receiving and processing data you can check the Azure management Stream Analytics monitor.
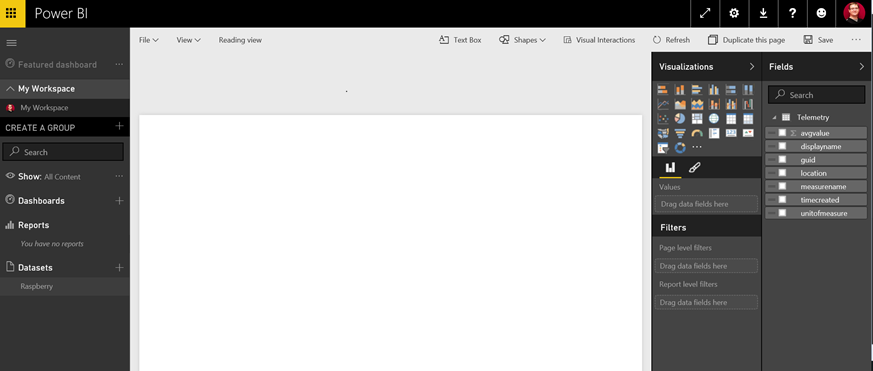
Once the datasource becomes available you can start creating reports. To create a new Report click on the Raspberry datasource:
Power BI: Report Designer
The Report designer will be opened showing the list of fields available for the selected datasource and the different visualizations supported by the tool.
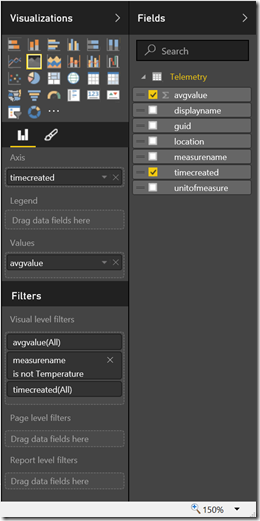
To create the Average Light by time report, select the following fields:
- avgvalue
- timecreated
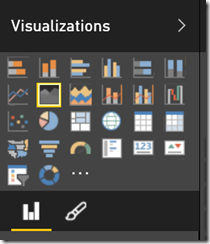
As you can see the avgvalue field is automatically set to the Value field and the timecreated is inserted as an axis. Now change the chart type to a Line Chart:
Selecting the Line Chart
Then you will set a filter to show only the Light sensor data. To do so drag the measurename field to the Filters section and then select the Light value:
Selecting the Report Filters
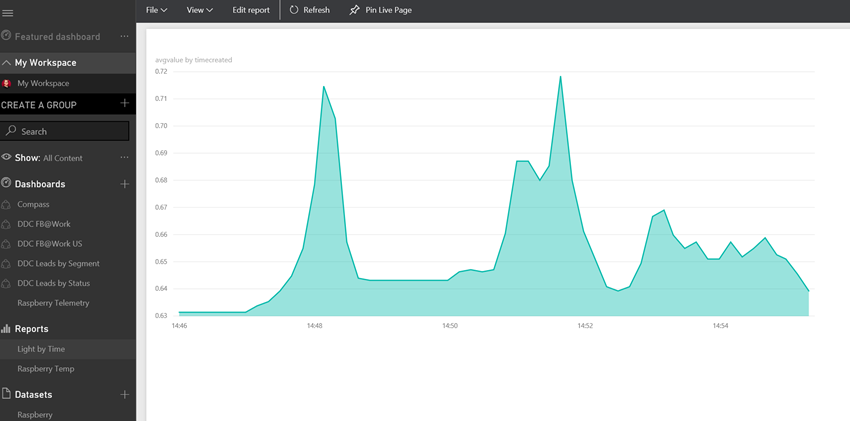
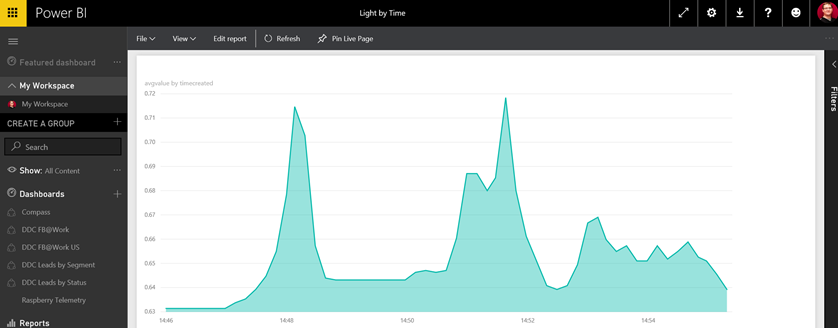
Now the report is almost ready. Click the SAVE button and set Light by Time as the name for the report.
Light by Time Report
Now you will create a new Dashboard, and pin this report to it. Click the plus sign (+) next to the Dashboards section to create a new dashboard. Set Raspberry Telemetry as the Title and press Enter. Now, go back to your report and click the pin icon to add the report to the recently created dashboard.
Pinning a Report to the Dashboard
To create a second chart with the information of the average Temperature follow these steps:
Click on the Raspberry datasource to create a new report.
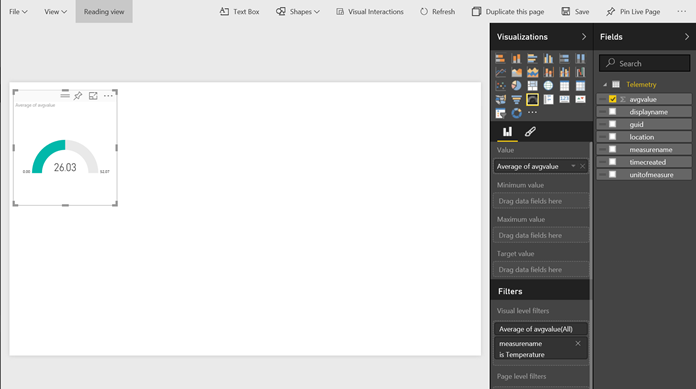
Select the avgvalue field
Drag the measurename field to the filters section and select Temperature
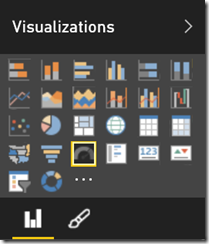
Now change the visualization to a gauge chart:
Gauge visualization
Change the Value from Sum to Average
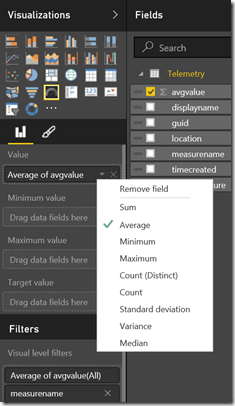
Change Value to Average Now the Report is ready
Gauge Report - Save and then Pin it to the Dashboard.
Following the same directions, create a Temperature report and add it to the dashboard. Lastly, edit the reports name in the dashboard by clicking the pencil icon next to each report.
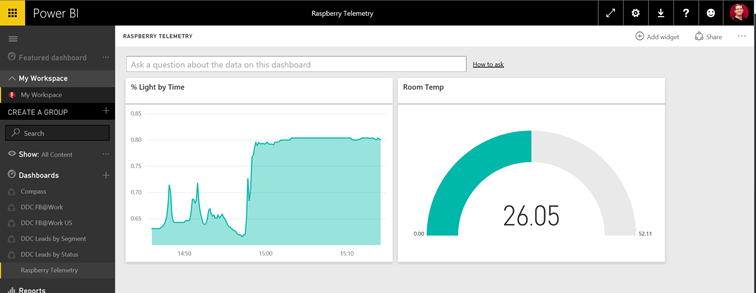
After renaming both reports you will get a dashboard similar to the one in the following screenshot, which will be automatically refreshed as new data arrives
Final Power BI Dashboard
So in this blog we covered how to visualize data which has been recorded by a Reaspberry Pi into Azure IOT Hub and then presented into Microsoft Power BI.
Comments
- Anonymous
January 17, 2017
Hi,When setting up the IotStream output I am asked for a PowerBI login. I have a PowerBI account bit the credentials do not work. Do I need a work account (paid O365 subscription) for this to work?
