Getting to Grip with the App-V Server Log File (sft-server.log)
Now I have been chatting with Aaron Parker about doing this blog entry for weeks and just never found the time to do this, well with the Easter weekend upon us and a workshop for which I need to complete a section on Log File analysis this seemed a good time to do it!
The Server Log file has so much good information. But it can be extremely painful to read the file in its native format. Just imagine reading 20mbs of this;

I tell you its not fun! And I have done it!!!!!
However there are some smart and easy tools out there to help you in your hour of pain! The core things you are going to need today are;
1) The App-V Server log file
The log files are located
•Microsoft SoftGrid:
%ProgramFiles%\Softricity\SoftGrid Server\logs
•Microsoft App-V:
%ProgramFiles%\Microsoft System Center App Virt Management Server\App Virt Management Server
2) Microsoft Excel (Now I use Excel 2007)
Also I wanted to refer back to the App-V blog just to highlight some information from the App-V Server logs.
SFT-Server.log
Description: Stores messages from the SoftGrid Virtual Application Server.
Path: %ProgramFiles%\Softricity\SoftGrid Server\logs
Note: In App-V 4.5 the directory is now called "Microsoft System Center App Virt Management Server\App Virt Management Server", not Softricity\SoftGrid Server. For more information see 930871.
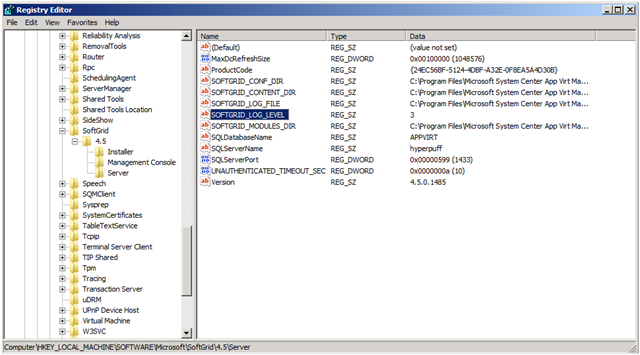
The logging level for the Application Virtualization Management Server can be changed in the registry at:
HKEY_LOCAL_MACHINE\SOFTWARE\MICROSOFT\SOFTGRID\4.5\SERVER\SOFTGRID_LOG_LEVEL
The logging levels range in values from 1-5 as outlined below:
• 0: Transactions
• 1: Fatal Errors
• 2: Errors
• 3: Warnings
• 4: Informational
• 5: Debug (Verbose)
The default is 3:
When the logging level is changed for the Application Virtualization Management Server, a restart of the service is required to pick up the change. To do this follow the steps below:
1. Click on START>RUN and type "Services.msc"
2. Scroll down and select "Application Virtualization Management Server"
3. In the column to the left, click on "Restart the service"
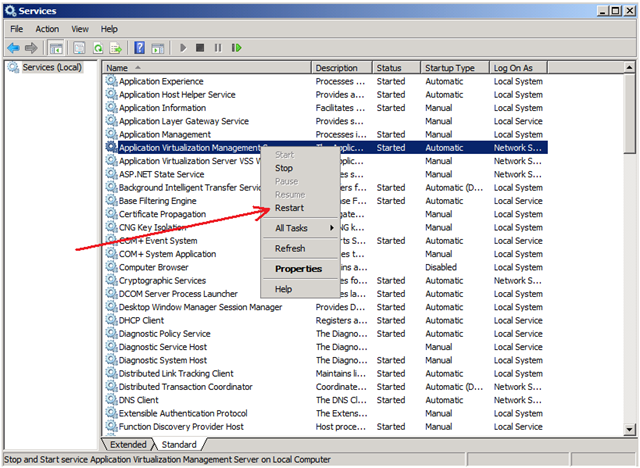
Once you restart the service you should be good to go. You must restart the service for the new log level to take effect. One last thing I'll also mention is to be sure you set the value back to it's default once you're done troubleshooting. Some of these options can generate a ton of output and you don't want that overhead weighing you down unless absolutely necessary.
Now I am done with the reference we can get down to the dealing with the log files!
Using the log file to your Advantage!
So retrieve your App-V Server Log file (sft-server.log) from your Management Server and bring this to your client for analysis.
1) Open Excel
2) Click the “Orb” and than select Open, In the Open dialogue change the file type to “All Files” and now browse and locate your App-V Server log file and then select “Open”.

3) A new dialogue box will Appear called the “Text Import Wizard – Step 1 of 3”, when this wizard opens select the option for “Delimited” and then click Next.

4) In the “Text Import Wizard – Step 2 of 3” check the check box for “space” (you should see some lines now break the data in the data preview) and then click Next.

5)In the “Test Import Wizard – Step 3 or 3” click Finish.

6) Your data will now appear in the excel tables, However the data will not have titles and there are a few formatting exercises that I like to completed.

7)Select Column “A” This is the date of the error. You will notice that the date is formatted like” [2008-10-09”, what we want to do is remove the “[“ from column “A”, so select the column click “ctrl+f” to bring up the Find and Replace dialogue box and Find “ [ “ and replace it with Nothing and than click Replace All and then click close.

8) Notice the Date is now correctly formatted for my zone.

9) We now need to do a similar activity with Column B. Column B will show us the time. You will notice that the time is formatted like” 00:37:37.011] ”, what we want to do is remove the “ ] “ from column “B”, so select the column click “ctrl+f” to bring up the Find and Replace dialogue box and Find “ ] “ and replace it with Nothing and than click Replace All and then click close.

10) Column B data will now look slightly different, But not like a time. This will need a formatting change

Select Column B and right click and than select format cells

Now select Time and in the Type select how you would like your Time to appear

The time will now be formatted nicely for our data analysis.

11) Insert a new row at row 1, so that there is now a blank row at the top.

We will use this blank row to put our data types in.
Copy and paste the below into Row A1
Date,Time,Servername,Process ID,Thread ID,Module Name,Session ID,Provider Name,Username,SFT File,Severity Level,(Error) Code,Message
Just to put this into context….
Date the Date the message was generated
Time The time the message was generated.
Servername The name of the server in which this thread is executing.
pid The pid that generated the message.
tid The tid that generated the message.
module The module that generated the message.
sid The sid (session id) for which the message was generated.
provider The site for which the message was generated.
user The user for which the message was generated.
package The application for which the message was generated.
error level The level of the message, in decimal format.
result code The code of the message, in decimal format.
message text The text of the message.
12) Once copied into Row A1, Select Data in the Excel Tabs, and than select “Text to Columns”

13) The “Convert Text to Columns Wizard – Step 1 of 3” dialogue box appears, Click “Delimited” and then click Next.

14) In the “Convert Text to Columns Wizard – Step 2 of 3” dialogue box check the Comma box and then click Finish.

Notice now how the Titles are correct for each column

15) Now that the data is formatted nicely this is where the fun can really start!!!! There is a feature in Excel Called Pivot tables and it makes life so much easier to review the log files, look at trends, see data over a month period!
So lets get started!
16) Select all your data, you can do this by clicking the top left corner square, Then select the Insert TAB in Excel, When in the insert TAB click the Pivot Table Button.

17) In the Create PivotTable Click OK.

18) A new sheet will open and this is where you can create some great Pivot Tables and review your data

19) Once you get to this stage you can do some great stuff! And its totally down to you how you want to play with the data!
You can drag items from the PivotTable Field List to the fields underneath it;

You can then expand some of the details to see the errors, for example in the screenshoot above shows error message 44934 on the server 361 times . This error message shows
| The Application Virtualization Client version is 4.2.0.310 on client 10.81.84.40:49316 does not meet the minimum system compatibility requirements for Application Virtualization Server version 4.5 |
| The Application Virtualization Client version is 4.2.0.310 on client 10.81.84.40:49337 does not meet the minimum system compatibility requirements for Application Virtualization Server version 4.5 |
| The Application Virtualization Client version is 4.2.0.310 on client 10.81.84.40:49809 does not meet the minimum system compatibility requirements for Application Virtualization Server version 4.5 |
| The Application Virtualization Client version is 4.2.0.310 on client 10.81.84.40:49906 does not meet the minimum system compatibility requirements for Application Virtualization Server version 4.5 |
| The Application Virtualization Client version is 4.2.0.310 on client 10.81.84.40:49932 does not meet the minimum system compatibility requirements for Application Virtualization Server version 4.5 |

Which show that there are legacy clients connecting to a 4.5 Server.
Remember our Upgrade process for App-V ….. All Clients , than All Servers, Than sequencer!!!! In other words you can see clients that are connecting to the server that should not be!!
20) You can than delve deeper on that particular message from the pivot table, in the value fields you can double click on the value to give you a break down of the values from the log file. The highlighted section below is where you can double click;

The results that it will show you will be

I hope this overview of using the log file helps you troubleshoot and break down the sft-server.log file better and makes your lives easier as App-V admins!!!
Feel free to post your comments on the best ways to manipulate the data in the pivot tables… Remember this is just a starter, so please please have a play!