Note
Access to this page requires authorization. You can try signing in or changing directories.
Access to this page requires authorization. You can try changing directories.
Now that you’ve had a day or two to work with the latest build of Visual Studio 11 Developer Preview and the .Net Framework 4.5 Developer Preview, I’m positive that you’re at the point where you would like to visualize the behavior of your multithreaded application. Remembering how you did that in Visual Studio 2010 the first actions you will take are to open the Analyze menu, launch the Performance Wizard and select “Visualize the behavior of a multithreaded application”. But you will not be able to do this because the visualize option does not exist in the Visual Studio 11 DP Performance Wizard. Where did it go? The Concurrency Visualizer became its own menu item in the Visual Studio 11 DP Analyze menu. What are some of the other changes for the Concurrency Visualizer between Visual Studio 2010 and Visual Studio 11 Developer Preview?
CPU Utilization View
(To collect the traces for this post I launched Outlook 2010 and when it finished loading, I manually closed the main window to exit the process.)
The first thing to notice when collecting a trace in Visual Studio 11 DP vs. 2010 is that instead of requiring Visual Studio to be opened with elevated credentials, tracing an application will prompt for elevated credentials for the CVCollectionService. This allows developers to continue running Visual Studio without requiring elevated credentials. The second thing to notice is the reduced time of parsing and analyzing a trace. Many performance improvements went into ETW parsing and analysis for Visual Studio 11 DP. The result is that the amount of time between stopping the ETW session and visualizing the trace is less than a third of the time it took in Visual Studio 2010. The third noticeable difference is the colors in the CPU Utilization view; they are not as bold and are easier on the eyes. The Other Processes category is still on top of the System Process category which is on top of the Idle Process category, which is on top of the process being traced.
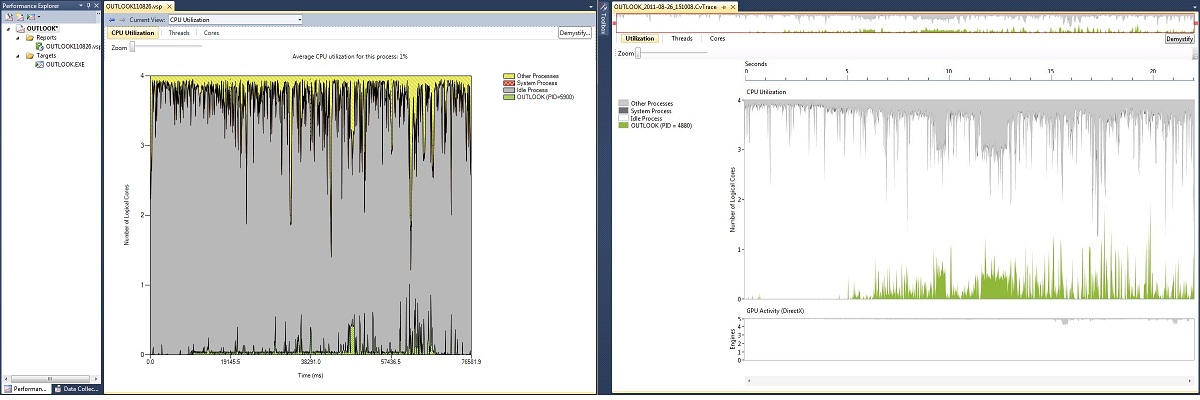
The last item which jumps out as an immediate difference is the box at the top of the window which looks like a stretched out version of the CPU Utilization view, but with a red box around it. This is the chart zoom control and it is a consistent view between the CPU, Threads, and Cores views. As the active view is zoomed in or panned over, the red box of the chart zoom control will zoom in and pan over correspondingly. In addition, if the handles on the chart zoom control are directly dragged, the active view will zoom and pan as well. This chart is helpful in correlating utilization between the different views.
Threads View
The Threads View in Visual Studio 11 Developer Preview is noticeably more similar to its counterpart from Visual Studio 2010 than the CPU Utilization View. The Disk Read/Write swim lanes still appear as the top swim lanes and the I/O segments are the same shade of purple. As a matter of fact nearly all of the colors of the threads view are the same in Visual Studio 11 DP as they were in Visual Studio 2010. The thread blocking connector is darker in Visual Studio 11 DP to help the eyes make a stronger connection between the two threads. Something which does stand out as different is that the buttons in the active legend are underlined and blue in Visual Studio 11 DP. This is to help encourage developers to select the profile reports and see the information which the different reports contain.
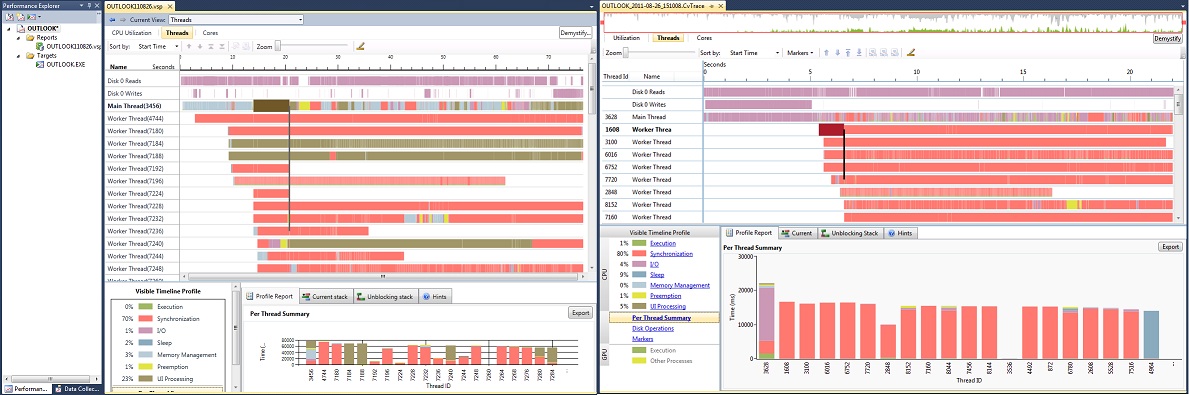
One nice feature which was added for Visual Studio 11 DP is the ability to select a couple of thread swim lanes, opening the context menu, and then select “Hide All Except Selection”. This hides all of the unselected swim lanes helping a developer quickly narrow down on the few threads they are interested in investigating.
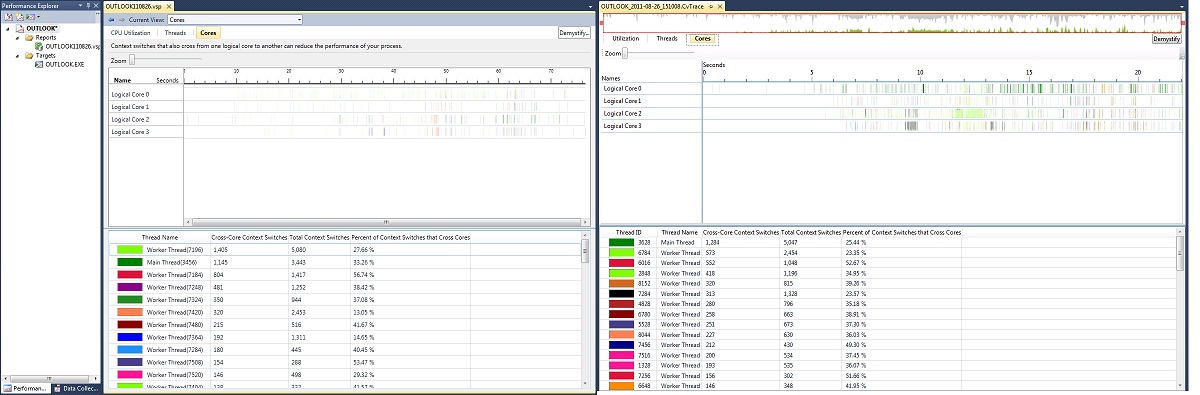
Cores View
Like the Threads view, the Cores view has a similar layout and color scheme in Visual Studio 11 DP as it did in Visual Studio 2010. Something new since Visual Studio 2010 is that a thread can be selected in the bottom half of the view, and this will filter the Logical Core swim lanes to show activity from just that thread.
Now that you know how to visualize the behavior of a multi-threaded application in Visual Studio 11 Developer Preview, I hope that you will find it a useful tool in understanding many of the different aspects and behaviors of your applications.