Note
Access to this page requires authorization. You can try signing in or changing directories.
Access to this page requires authorization. You can try changing directories.
Overview
Do you need to debug something but hate stepping through 100s-1000s lines of code? Do you wish there was a faster way to answer "What is the problem?" If you answered Yes to either, then read on to learn more about using Time Travel Debugging (TTD) queries to streamline debugging.
Software is a complex interaction of code and data. TTD records code and data interactions of a running app or process into a trace file which can be replayed in a debugger. To use SQL terms, the trace file is a database and the debugger offers a cursor (one row of data at a time) to step through individual lines of code. Even greater value and versatility is realized by executing a query to search across multiple rows of data and provide results in a single view. Using a query enables powerful debugging experiences to find a problem faster by searching the entire code execution instead of stepping through individual lines of code.
You can use a LINQ query to search a trace file by function calls, time positions, memory addresses, register contents, etc. See the Writing LINQ queries in WinDbg blog post for more details on writing queries.
Debugging using a query is great because:
- Faster than conditional breakpoints
- Control results using LINQ
- Visualize patterns in grid view
Query Scenario
The best way to show why debugging using a query is great is to walk through a simple scenario. This scenario records the code execution of the File Open dialog in 64-bit Notepad and replays the trace file in the debugger to identify all the places where GetLastError returns a non-zero error code. Here is the hardware and software configuration used to measure results of this scenario.
| Hardware | Software | Trace file |
| SurfaceBook 2i7-8650, 2GHz, 4 cores + hyperthreading16GB RAMPCIe SSD | Windows 10 build 16299WinDbg Preview from Store | Size on disk: 469,762,048 bytesrepresents about 446 million instructions |
Faster than conditional breakpoints
In traditional debugging, a conditional breakpoint would be used as follows to identify all the places where GetLastError returns a non-zero error code.
| Debugger command | Description | Result |
| bp kernelbase!GetLastError+c "j @rax==0 'gc';'?@rax;gc'" | Looks at the value of register rax at the ret instruction and prints the value if it is non-zero. "+c" comes from disassembling kernelbase!GetLastError and locating the 'ret' instruction relative to the start of GetLastError. The rax register holds the return value of GetLastError for 64-bit software on Windows. Click here to learn more about conditional breakpoints | This takes a long time using trace file. The command was stopped after 30 minutes and was only a little over halfway through the trace file. This approach works okay when debugging a live process but often is not practical in TTD traces. |
Now let's try the same thing with a query.
| Debugger command | Description | Result |
| dx @$e = @$cursession.TTD.Calls("kernelbase!GetLastError").Where(c => c.ReturnValue != 0) | The dx command displays information from the debugger data model and provides an extensible query engine using LINQ syntax. TTD provides extensions to the query engine which enables fast access to the call and memory activity in a trace file. | This query completes in about 20 seconds which is roughly 100x faster than using conditional breakpoints. In fact, collecting the query results from a trace file is faster than using conditional breakpoints in a live process (which takes about 26 seconds for a similar workload)! |
Let's review the query in more detail by breaking the command into parts.
| Debugger command | Description |
| dx @$var = <expression> | Assign the result of a query to a variable |
| dx @$cursession.TTD.Calls("kernelbase!GetLastError").First() | Get the first item to see the available fields. Click here to learn more about available fields. In this scenario, we only want the ReturnValue and TimeEnd fields. kernelbase!GetLastError" is the module and function name we want to query. The module name is not required but improves query speed and avoids ambiguities between modules. |
| .Where(c => c.ReturnValue != 0) | Where clause to restrict the results to non-zero return values. This is accomplished through a lambda expression |
So why is executing a query so much faster than a conditional breakpoint?
- TTD uses a fully multi-threaded replay engine and indexing to quickly locate information when executing a query; whereas the debugger uses a single thread to evaluate a conditional breakpoint
- Arcane conditional breakpoint syntax is replaced with more familiar LINQ commands and field names
- No need to disassemble functions to locate 'ret' statements
- No need to know which register contains the return value (which varies by processor architecture and calling convention)
Control results using LINQ
Conditional breakpoints are generally used to break into the debugger or log information when a condition is met; but there is no mechanism to further filter, sort or group the information. A query supports filter, sort and group of result data using familiar LINQ syntax against the data model. See MSDN for more examples of using LINQ with debugger data model.
Filter
| Debugger command | Description | Result |
| dx @$cursession.TTD.Calls("kernelbase!GetLastError").Where(c => c.ReturnValue != 0) | Use the Where() method to filter the number of rows returned from the query. This example returns rows where ReturnValue is not zero. | |
| dx -r2 @$s = @$cursession.TTD.Calls("kernelbase!GetLastError").Where(c => c.ReturnValue != 0).Select(c => new { Time = c.TimeStart, Error = c.ReturnValue }) | Use the Select() method to choose which columns to see and modify the column display name. This example returns rows where ReturnValue is not zero and selects to display the TimeStart and ReturnValue columns with custom display names of Time and Error. | [0x26]Time : 412F:275 [Time Travel]Error : 0x57[0x27]Time : 4021:275 [Time Travel]Error : 0x57 |
Sort
| Debugger command | Description |
| dx -r2 @$cursession.TTD.Calls("kernelbase!GetLastError").OrderBy(c => c.TimeStart)dx -r2 @$cursession.TTD.Calls("kernelbase!GetLastError").OrderByDescending(c => c.TimeStart) | Use the OrderBy() method to sort the rows returned from the query by one or more columns. This example sorts by TimeStart in ascending and descending order. |
| dx -r2 @$cursession.TTD.Calls("kernelbase!GetLastError").OrderBy(c => c.TimeStart, @$cursession.TTD.Utility.compareTime) | Older versions of the debugger sort using this format. |
Group
| Debugger command | Description | Result |
| dx @$s.GroupBy(x => x.Error) | Use the GroupBy() method to group data returned by the query to do more powerful analysis since the results are structured. This example groups the time locations by error number. Note: @$s is the result of the previous query. You can assign query execution results to a variable and use that variable in future expressions. | @$s.GroupBy(x => x.Error)[0x57][0x3f0][0xea] |
Visualize patterns in grid view
By default, the results of a query are shown in detail view. You can also see the results in a grid view to help you visualize the results better to identify patterns and find problems faster. Just add -g to any dx command to see the results in a grid view. See the Writing LINQ queries in WinDbg blog post for more grid view details and examples.
Example of what a grid view looks like in the debugger 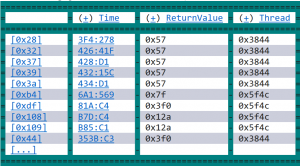
Comments
- Anonymous
March 23, 2018
Is there any plan to release this tool outside of the Windows Store? I would really like to use it, but we have a corporate group policy that disallows use of the Windows Store.- Anonymous
April 18, 2018
If you look at the WinDbg Preview FAQ we answer this. We'll be looking at shipping in the SDK and WDK in the future, but at this point we're staying in the Store.
- Anonymous