Note
Access to this page requires authorization. You can try signing in or changing directories.
Access to this page requires authorization. You can try changing directories.
Hi Everyone!
For those of you that haven't seen, we recorded an episode of Defrag Tools with our friend Andrew Richards where we talked a bit about the debugger object model. You can find it here!
Today I'm going to do a tutorial covering the basics of how to write a LINQ query from start to finish for those of you that might not be familiar with LINQ and the thought processes behind creating a query. Let's start with the basics. What is LINQ and why should you care about it?
LINQ?
LINQ is a query language conceptually similar to SQL that can be used to query data, you can read a bit more about it here. C# developers are likely familiar with LINQ and how useful it is when looking at data. For those of you that aren't familiar or haven't looked at LINQ from the debugging perspective, it adds amazing value, it lets you take some structured data (in our case, the debugger object model) and query it to produce the exact output you want. It’s worth noting that our LINQ support uses the “method syntax” of LINQ and not the “query syntax” you can find more details about the differences on MSDN here.
In the past, if you were investigating an issue you've never seen before, your workflow would likely involve running a few debugger commands you're familiar with, and then searching for an extension or debugger command related to the issue you're looking at. Then you would learn the syntax of the command, run it, spend some time understanding the output, and hopefully the person who wrote the extension added the data that you want and outputs it in a friendly way.
For example, the query we're going to write today covers a few simple LINQ concepts and does a pretty basic task of getting the list of processes in a kernel debug session and the number of threads for each of those processes. I asked a few developers how they would accomplish this and got the four different answers:
- Many people said '!process 0 <n>' and no one was quite confident which value of n would give them the right verbosity to get '!process' to show the list of threads.
- A couple people said '!process 0 0' followed by !threads for the processes I care about
- One said he would write a debugger extension
- One said she would ask someone else what they would do
None of those(except writing a new extension) actually give exactly what we'd want. Each of those spit out a list of threads, so we could take that list and count each individually or put it into Excel, but that's not very helpful. If I want to correlate the number of threads to another piece of data that might be relevant, like the number of modules, I'd have to go through the same process to figure out what extension contains module information. So let's see how we'd do this in LINQ!
Tips
A few generic tips:
- 'dx' has tab-complete, even inside LINQ queries. So even when queries get a bit verbose, it's easier to type than it looks.
- Try using WinDbg's command browser window, it's a good way to click back and forth between queries.
- If you click around 'dx' links, the debugger will automatically add some quotation marks and @ signs to ensure that the query is perfect. You don't need those if you're writing queries yourself.
- Read through the MSDN page, there's a lot of good tips and examples there.
Query Writing
Note that what I'm walking through is just one way of thinking about this, there's many different processes people have for writing queries. The query we're going to write today is to get a list of all the processes in a kernel debug session and the number of threads inside each of those processes.
The three basic steps to writing a query are:
- Figure out what you want to return
- Search through the debugger namespaces for the data you want to return
- Write the query
What to return?
We pretty much already said this above when we were defining the question:
- A list of processes
- The name of each process
- The number of threads for each of those processes
Where is the data?
This varies depending on what you're doing, I start by clicking around a 'dx Debugger' query. So a bit of digging gives me:
- 'dx Debugger.Sessions[0].Processes' contains a list of all the processes, and if I click one of those it looks into a single process
- 'dx Debugger.Sessions[0].Processes[4]' which has a "Threads" object I can click that has the whole list of threads.
Now I know that all the processes are listed under the "Sessions" object, and all the threads are listed under the "Process" object.
Write the query
Finally, the harder part, actually writing the query. I'm going to go through step-by-step and highlight the changes in each step. Note that the command outputs I'm putting here are truncated to show only a few rows of data. In this example I’m in a kernel debugger session, but the concepts work in both user-mode and kernel-mode.
I know I'm going to be looking at processes, so I need to "root" my query at the processes level, I have three options for that. Options 1 and 2 are pretty similar, they'll work for the current session I'm in, but if I share my query or have multiple targets at once, they won't work. The third option is a bit shorter and will always target my current session.
| Input:1. dx Debugger.Sessions[0].Processes2. dx Debugger.Sessions.First().Processes3. dx @$cursession.Processes | Output: |
Now that we've got the start, we need to select the process name and thread count from that namespace. This is where LINQ comes in, let's start with just getting the process name. The syntax inside the Select is LINQ's lambda syntax and is described on the 'dx' MSDN page here.
| Input:dx @$cursession.Processes.Select(p => p.Name) | Output: |
We don't just want the name though, we'll also need the number of threads, so let's grab the thread object also. Because we're grabbing two fields, we need to create an anonymous type, similar to C#'s anonymous type syntax.
| Input:dx @$cursession.Processes.Select(p => new {Name = p.Name, Threads = p.Threads} ) | Output: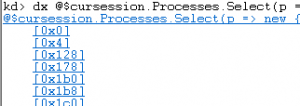 |
With that command, 'dx' doesn't actually print out the name anymore, just a link. Adding -r2 (recurse two levels) will fix that.
| Input:dx -r2 @$cursession.Processes.Select(p => new {Name = p.Name, Threads = p.Threads}) | Output: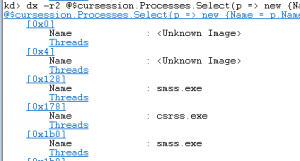 |
Now we have the name of the process and the list of threads, but that's not quite what we want, we want the number of threads.
| Input:dx - r2 @$cursession.Processes.Select(p => new {Name = p.Name, ThreadCount = p.Threads .Count() }) | Output: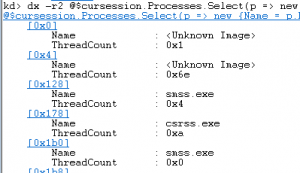 |
We're almost done! When writing this, I originally was looking at what processes had a large number of threads, so let's order the list by thread count.
| Input:dx - r2 @$cursession.Processes.Select(p => new {Name = p.Name, ThreadCount = p.Threads.Count()}) .OrderByDescending(p => p.ThreadCount) | Output: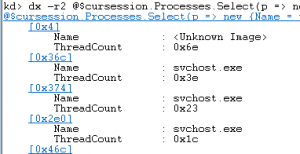 |
Since I'm going to share this, I want it to be as polished as possible. Most people have an easier time reading decimal, so I’m going to add the ',d' format specifier(see the 'dx' MSDN page for the full list of possible specifiers) to output decimal. Also, grids are a bit prettier than lists, so I'm changing the '-r2' to be '-g'. I no longer need the ‘-r2’ because ‘-g’ picks the right columns for me.
| Input:dx -g @$cursession.Processes.Select(p => new {Name = p.Name, ThreadCount = p.Threads.Count()}).OrderByDescending(p => p.ThreadCount) ,d | Output: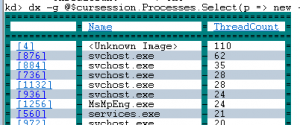 |
There you have it, we just wrote a query to sort processes by the number of threads! If you want an exercise, earlier I mentioned that you could easily modify this query to also list the number of modules in the process, can you modify the query we just wrote to also include the number of modules? Note that this will give you the number of kernel modules, so every process will have the same number in this example.
Feel free to leave any questions, comments, or cool LINQ queries you come up with in the comments below.
-Andy
@aluhrs13
Comments
- Anonymous
October 05, 2016
Is there anything like this for managed code?- Anonymous
October 05, 2016
What do you mean? This can be done in any WinDbg session.- Anonymous
October 06, 2016
Hmmm.........Actually, no. 0: kd> dx Debugger.Sessions[0].ProcessesDebugger.Sessions[0].Processes 0: kd> dx Debugger.Sessions.First().ProcessesDebugger.Sessions.First().Processes 0: kd> dx @$cursession.Processes@$cursession.ProcessesNot much useful output.- Anonymous
October 06, 2016
Looks like you might be hitting an issue that's hard to troubleshoot over comments. Can you email windbgfb at microsoft dot com with some details of your setup like OS and debugger version and what you're targeting(kdnet, dump file, kdsrv, etc)- Anonymous
October 10, 2016
The comment has been removed - Anonymous
November 03, 2016
This is awsome. However, as pointed out, doesn't work (tested for windbg 10.0.14321 targeting win 8.1)
- Anonymous
- Anonymous
- Anonymous
- Anonymous
October 18, 2016
See this for managed code:http://netext.codeplex.com
- Anonymous
- Anonymous
October 06, 2016
Wow, this is deep. For somebody who's never worked outside of the IDE debug tools, (Visual Studio) this looks like greek. How can I go about learning to this type of deep debugging? - Anonymous
October 13, 2016
Andy,Thanks a lot for this great post based on my request! Appreciate it!