案例分析 | 微软Virtualization: 在Microsoft Virtualization上运行MSDN与TechNet
众所周知,对于微软技术人员,最常使用的两个站点就是MSDN与TechNet。从Hyper-V的Beta开始,微软就将MSDN与TechNet这两个重量级站点部署到虚拟化上。
一方面凸显了微软对产品的信心,一方面也是测试技术,尽早发现不足,并将重要的发现以及经验教训与客户分享。
微软基于早期部署,发布了一篇重要的文档,可以供正在评估虚拟化的用户参考。这篇文章详细的解答了两个问题:
1: 微软虚拟化技术是否可以用于生产环境
2:虚拟化后的整体稳定性与性能如何
文章下载:
Microsoft.com Operations Virtualizes MSDN and TechNet on Hyper-V
在文章中,针对稳定性与性能做了比较详细的分析,如下:
MSDN and TechNet Virtualization Results
The results of our implementation MSDN and TechNet on Hyper-V RC0 are summarized in the following sections: Stability, Performance, and Lessons Learned.
Stability
- · Hyper-V has been exceptionally stable, proving capable of delivering the end-to-end availability of MSDN and TechNet compared to the previous physical platform during both beta and RC0 usage. In fact, for the deployment so far, MSCOM Ops has not encountered a single production-impacting bug. This is definitely quite an accomplishment for the Hyper-V development team.
- · Log Parser analysis of the IIS logs showed that the error rates were comparable between the virtual and physical instances.
Performance
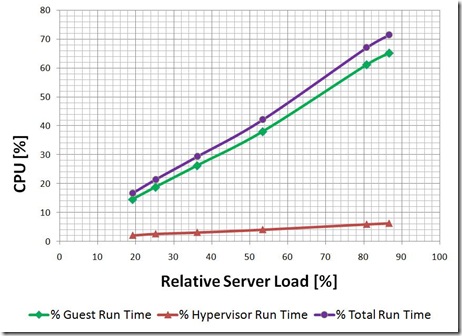
- Hyper-V CPU overhead (as measured by the parent partition utilization) was 5 to 6 percent with linear progression as the number of requests increased. This is illustrated in Figure 2.
- CPU oversubscription (three four-processor VMs on an eight-processor physical server) resulted in 3 percent lower overall performance per physical server based on overall requests per second per 1 percent CPU.
- Requests per second per 1 percent CPU performance of MSDN over the previous physical server platform improved. This demonstrates to us the viability of efficient consolidation from dedicated older physical servers to shared virtualized platforms.
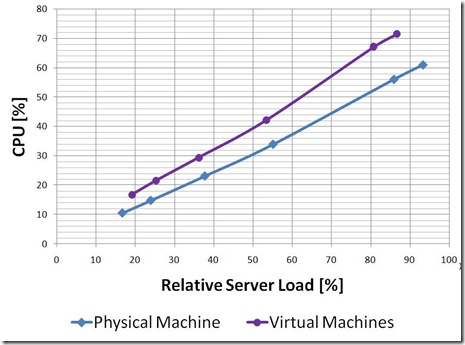
- Physical MSDN handled 21 percent more requests per second per 1 percent CPU than virtualized MSDN. Figure 3 illustrates physical compared to virtual scale up for MSDN under peak production load on matching hardware.
Note: Requests per 1 percent CPU was a primary performance benchmark for our MSDN deployment because it distilled Hyper-V's effects down to a simple, but meaningful, number for these Web sites.
Figure 2 illustrates a detailed breakout of virtual machine, Hyper-V, and guest CPU utilization.
Figure 2. 5-6% CPU Hyper-V Cost on Physical Blade with Reasonably Linear Progression as Number of Requests Increase
Figure 3 illustrates how we used two blade servers to compare high utilization physical to virtual scalability. Lower CPU utilization is better.
Figure 3. Reasonably Linear CPU Utilization Progression Using MSDN Production Load
重要的经验总结:
- Based on our results with Hyper-V, and a review of current hardware utilization across our environment, we expect to realize significant benefits by consolidating diverse applications on a virtualized platform. Mixing high and low scale systems on the same physical server resources should enable us achieve improved overall hardware utilization and a reduced physical footprint.
- Although we reduced our hardware supporting MSDN and TechNet by migrating from older physical servers to a smaller deployment of new, more powerful physical servers, there is some minimal overhead associated with virtualization. From our perspective, Hyper-V has clearly delivered enough performance, stability, and scale to drive widespread adoption in our production environment. The flexibility and management gains expected from coupling System Center Virtual Machine Manager (SCVMM) v2 with Hyper-V should justify the measured overhead.
- If the three percent or less in additional overhead from oversubscribing resources is consistent with additional application workloads tested, oversubscription with Hyper-V should provide MSCOM Ops significant flexibility and reasonable performance for application consolidation.
- The results we achieved are based on the application characteristics of MSDN and TechNet on Hyper-V RC0. We are working to build a model based on this data that we hope will allow us to predict physical and VM requirements based on common performance characteristics of a Web site. The model will likely include the current requests per second per 1 percent CPU metric with additional memory and I/O performance characteristics as we virtualize other Web applications and gather more test and production data.

