JIT and Run
Drill Into .NET Framework Internals to See How the CLR Creates Runtime Objects
Hanu Kommalapati and Tom Christian
This article discusses:
|
This article uses the following technologies: .NET Framework, C# |
Contents
Domains Created by the CLR Bootstrap
System Domain
SharedDomain
DefaultDomain
LoaderHeaps
Type Fundamentals
ObjectInstance
MethodTable
Base Instance Size
Method Slot Table
MethodDesc
Interface Vtable Map and Interface Map
Virtual Dispatch
Static Variables
EEClass
Conclusion
Since the common language runtime (CLR) will be the premiere infrastructure for building applications in Windows® for some time to come, gaining a deep understanding of it will help you build efficient, industrial-strength applications. In this article, we'll explore CLR internals, including object instance layout, method table layout, method dispatching, interface-based dispatching, and various data structures.
We'll be using very simple code samples written in C#, so any implicit references to language syntax should default to C#. Some of the data structures and algorithms discussed will change for the Microsoft® .NET Framework 2.0, but the concepts should largely remain the same. We'll use the Visual Studio® .NET 2003 Debugger and the debugger extension Son of Strike (SOS) to peek into the data structures we discuss in this article. SOS understands CLR internal data structures and dumps out useful information. See the "Son of Strike" sidebar for loading SOS.dll into the Visual Studio .NET 2003 debugger process. Throughout the article, we will describe classes that have corresponding implementations in the Shared Source CLI (SSCLI). Figure 1 will help you navigate the megabytes of code in the SSCLI while searching for the referenced structures.
Figure 1 SSCLI Reference
| Item | SSCLI Path |
|---|---|
| AppDomain | \sscli\clr\src\vm\appdomain.hpp |
| AppDomainStringLiteralMap | \sscli\clr\src\vm\stringliteralmap.h |
| BaseDomain | \sscli\clr\src\vm\appdomain.hpp |
| ClassLoader | \sscli\clr\src\vm\clsload.hpp |
| EEClass | \sscli\clr\src\vm\class.h |
| FieldDescs | \sscli\clr\src\vm\field.h |
| GCHeap | \sscli\clr\src\vm\gc.h |
| GlobalStringLiteralMap | \sscli\clr\src\vm\stringliteralmap.h |
| HandleTable | \sscli\clr\src\vm\handletable.h |
| InterfaceVTableMapMgr | \sscli\clr\src\vm\appdomain.hpp |
| Large Object Heap | \sscli\clr\src\vm\gc.h |
| LayoutKind | \sscli\clr\src\bcl\system\runtime\interopservices\layoutkind.cs |
| LoaderHeaps | \sscli\clr\src\inc\utilcode.h |
| MethodDescs | \sscli\clr\src\vm\method.hpp |
| MethodTables | \sscli\clr\src\vm\class.h |
| OBJECTREF | \sscli\clr\src\vm\typehandle.h |
| SecurityContext | \sscli\clr\src\vm\security.h |
| SecurityDescriptor | \sscli\clr\src\vm\security.h |
| SharedDomain | \sscli\clr\src\vm\appdomain.hpp |
| StructLayoutAttribute | \sscli\clr\src\bcl\system\runtime\interopservices\attributes.cs |
| SyncTableEntry | \sscli\clr\src\vm\syncblk.h |
| System namespace | \sscli\clr\src\bcl\system |
| SystemDomain | \sscli\clr\src\vm\appdomain.hpp |
| TypeHandle | \sscli\clr\src\vm\typehandle.h |
A word of caution before we start—the information provided in this article is only valid for the .NET Framework 1.1 (it's also mostly true for Shared Source CLI 1.0, with the most notable exceptions being some interop scenarios) when running on the x86 platform. This information will change for the .NET Framework 2.0, so please do not build software that relies on the constancy of these internal structures.
Domains Created by the CLR Bootstrap
Before the CLR executes the first line of the managed code, it creates three application domains. Two of these are opaque from within the managed code and are not even visible to CLR hosts. They can only be created through the CLR bootstrapping process facilitated by the shim—mscoree.dll and mscorwks.dll (or mscorsvr.dll for multiprocessor systems). As you can see in Figure 2, these are the System Domain and the Shared Domain, which are singletons. The third domain is the Default AppDomain, an instance of the AppDomain class that is the only named domain. For simple CLR hosts such as a console program, the default domain name is composed of the executable image name. Additional domains can be created from within managed code using the AppDomain.CreateDomain method or from unmanaged hosting code using the ICORRuntimeHost interface. Complicated hosts like ASP.NET create multiple domains based on the number of applications in a given Web site.
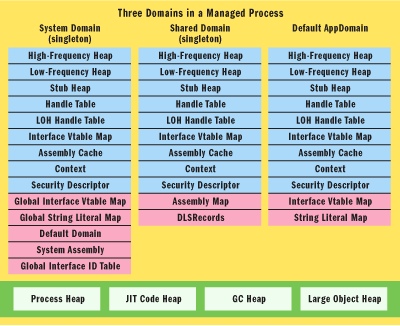
Figure 2** Domains Created by the CLR Bootstrap **
System Domain
The SystemDomain is responsible for creating and initializing the SharedDomain and the default AppDomain. It loads the system library mscorlib.dll into SharedDomain. It also keeps process-wide string literals interned implicitly or explicitly.
String interning is an optimization feature that's a little bit heavy-handed in the .NET Framework 1.1, as the CLR does not give assemblies the opportunity to opt out of the feature. Nonetheless, it saves memory by having only a single instance of the string for a given literal across all the application domains.
SystemDomain is also responsible for generating process-wide interface IDs, which are used in creating InterfaceVtableMaps in each AppDomain. SystemDomain keeps track of all the domains in the process and implements functionality for loading and unloading the AppDomains.
SharedDomain
All of the domain-neutral code is loaded into SharedDomain. Mscorlib, the system library, is needed by the user code in all the AppDomains. It is automatically loaded into SharedDomain. Fundamental types from the System namespace like Object, ValueType, Array, Enum, String, and Delegate get preloaded into this domain during the CLR bootstrapping process. User code can also be loaded into this domain, using LoaderOptimization attributes specified by the CLR hosting app while calling CorBindToRuntimeEx. Console programs can load code into SharedDomain by annotating the app's Main method with a System.LoaderOptimizationAttribute. SharedDomain also manages an assembly map indexed by the base address, which acts as a lookup table for managing shared dependencies of assemblies being loaded into DefaultDomain and of other AppDomains created in managed code. DefaultDomain is where non-shared user code is loaded.
DefaultDomain
DefaultDomain is an instance of AppDomain within which application code is typically executed. While some applications require additional AppDomains to be created at runtime (such as apps that have plug-in architectures or apps doing a significant amount of run-time code generation), most applications create one domain during their lifetime. All code that executes in this domain is context-bound at the domain level. If an application has multiple AppDomains, any cross-domain access will occur through .NET Remoting proxies. Additional intra-domain context boundaries can be created using types inherited from System.ContextBoundObject. Each AppDomain has its own SecurityDescriptor, SecurityContext, and DefaultContext, as well as its own loader heaps (High-Frequency Heap, Low-Frequency Heap, and Stub Heap), Handle Tables (Handle Table, Large Object Heap Handle Table), Interface Vtable Map Manager, and Assembly Cache.
LoaderHeaps
LoaderHeaps are meant for loading various runtime CLR artifacts and optimization artifacts that live for the lifetime of the domain. These heaps grow by predictable chunks to minimize fragmentation. LoaderHeaps are different from the garbage collector (GC) Heap (or multiple heaps in case of a symmetric multiprocessor or SMP) in that the GC Heap hosts object instances while LoaderHeaps hold together the type system. Frequently accessed artifacts like MethodTables, MethodDescs, FieldDescs, and Interface Maps get allocated on a HighFrequencyHeap, while less frequently accessed data structures, such as EEClass and ClassLoader and its lookup tables, get allocated on a LowFrequencyHeap. The StubHeap hosts stubs that facilitate code access security (CAS), COM wrapper calls, and P/Invoke.
Having examined the domains and LoaderHeaps at a high level, we'll now look at the physical details of these in the context of the simple app in Figure 3. We stopped the program execution at "mc.Method1();" and dumped the domain information using the SOS debugger extension command, DumpDomain (see the "Son of Strike" sidebar for SOS loading information). Here is the edited output:
!DumpDomain System Domain: 793e9d58, LowFrequencyHeap: 793e9dbc, HighFrequencyHeap: 793e9e14, StubHeap: 793e9e6c, Assembly: 0015aa68 [mscorlib], ClassLoader: 0015ab40 Shared Domain: 793eb278, LowFrequencyHeap: 793eb2dc, HighFrequencyHeap: 793eb334, StubHeap: 793eb38c, Assembly: 0015aa68 [mscorlib], ClassLoader: 0015ab40 Domain 1: 149100, LowFrequencyHeap: 00149164, HighFrequencyHeap: 001491bc, StubHeap: 00149214, Name: Sample1.exe, Assembly: 00164938 [Sample1], ClassLoader: 00164a78
Figure 3 Sample1.exe
using System; public interface MyInterface1 { void Method1(); void Method2(); } public interface MyInterface2 { void Method2(); void Method3(); } class MyClass : MyInterface1, MyInterface2 { public static string str = "MyString"; public static uint ui = 0xAAAAAAAA; public void Method1() { Console.WriteLine("Method1"); } public void Method2() { Console.WriteLine("Method2"); } public virtual void Method3() { Console.WriteLine("Method3"); } } class Program { static void Main() { MyClass mc = new MyClass(); MyInterface1 mi1 = mc; MyInterface2 mi2 = mc; int i = MyClass.str.Length; uint j = MyClass.ui; mc.Method1(); mi1.Method1(); mi1.Method2(); mi2.Method2(); mi2.Method3(); mc.Method3(); } }
Our console program, Sample1.exe, is loaded into an AppDomain which has a name "Sample1.exe." Mscorlib.dll is loaded into the SharedDomain but it is also listed against the SystemDomain as it is the core system library. A HighFrequencyHeap, LowFrequencyHeap, and StubHeap are allocated in each domain. The SystemDomain and the SharedDomain use the same ClassLoader, while the Default AppDomain uses its own.
The output does not show the reserved and committed sizes of the loader heaps. The HighFrequencyHeap initial reserve size is 32KB and its commit size is 4KB. LowFrequencyHeap and StubHeaps are initially reserved with 8KB and committed at 4KB. Also not shown in the SOS output is the InterfaceVtableMap heap. Each domain has a InterfaceVtableMap (referred to here as IVMap) that is created on its own LoaderHeap during the domain initialization phase. The IVMap heap is reserved at 4KB and is committed at 4KB initially. We'll discuss the significance of IVMap while exploring type layout in subsequent sections.
Figure 2 shows the default Process Heap, JIT Code Heap, GC Heap (for small objects) and Large Object Heap (for objects with size 85000 or more bytes) to illustrate the semantic difference between these and the loader heaps. The just-in-time (JIT) compiler generates x86 instructions and stores them on the JIT Code Heap. GC Heap and Large Object are the garbage-collected heaps on which managed objects are instantiated.
Type Fundamentals
A type is the fundamental unit of programming in .NET. In C#, a type can be declared using the class, struct, and interface keywords. Most types are explicitly created by the programmer, however, in special interoperability cases and remote object invocation (.NET Remoting) scenarios, the .NET CLR implicitly generates types. These generated types include COM and Runtime Callable Wrappers and Transparent Proxies.
We'll explore .NET type fundamentals by starting from a stack frame that contains an object reference (typically, the stack is one of the locations from which an object instance begins life). The code shown in Figure 4 contains a simple program with a console entry point that calls a static method. Method1 creates an instance of type SmallClass which contains a byte array used in demonstrating the creation of an object instance on a Large Object Heap. The code is trivial, but will serve for our discussion.
Figure 4 Large Objects and Small Objects
using System; class SmallClass { private byte[] _largeObj; public SmallClass(int size) { _largeObj = new byte[size]; _largeObj[0] = 0xAA; _largeObj[1] = 0xBB; _largeObj[2] = 0xCC; } public byte[] LargeObj { get { return this._largeObj; } } } class SimpleProgram { static void Main(string[] args) { SmallClass smallObj = SimpleProgram.Create(84930,10,15,20,25); return; } static SmallClass Create(int size1, int size2, int size3, int size4, int size5) { int objSize = size1 + size2 + size3 + size4 + size5; SmallClass smallObj = new SmallClass(objSize); return smallObj; } }
Figure 5 shows snapshot of a typical fastcall stack frame stopped at a breakpoint at the "return smallObj;" line inside the Create method. (Fastcall is the .NET calling convention which specifies that arguments to functions are to be passed in registers, when possible, with all other arguments passed on the stack right to left and popped later by the called function.) The value type local variable objSize is inlined within the stack frame. Reference type variables like smallObj are stored as a fixed size (a 4-byte DWORD) on the stack and contain the address of object instances allocated on the normal GC Heap. In traditional C++, this is an object pointer; in the managed world it's an object reference. Nonetheless, it contains the address of an object instance. We'll use the term ObjectInstance for the data structure located at the address pointed to by the object reference.
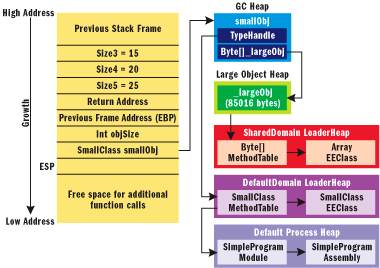
Figure 5** SimpleProgram Stack Frame and Heaps **
The smallObj object instance on the normal GC Heap contains a Byte[] called _largeObj, whose size is 85000 bytes (note that the figure shows 85016 bytes, which is the actual storage size). The CLR treats objects with sizes greater than or equal to 85000 bytes differently than the smaller objects. Large objects are allocated on a Large Object Heap (LOH), while smaller objects are created on a normal GC Heap, which optimizes the object allocation and garbage collection. The LOH is not compacted, whereas the GC Heap is compacted whenever a GC collection occurs. Moreover, the LOH is only collected on full GC collections.
The ObjectInstance of smallObj contains the TypeHandle that points to the MethodTable of the corresponding type. There will be one MethodTable for each declared type and all the object instances of the same type will point to the same MethodTable. This will contain information about the kind of type (interface, abstract class, concrete class, COM Wrapper, and proxy), the number of interfaces implemented, the interface map for method dispatch, the number of slots in the method table, and a table of slots that point to the implementations.
One important data structure MethodTable points to is EEClass. The CLR class loader creates EEClass from the metadata before MethodTable is laid out. In Figure 4, SmallClass's MethodTable points to its EEClass. These structures point to their modules and assemblies. MethodTable and EEClass are typically allocated on the domain-specific loader heaps. Byte[] is a special case; the MethodTable and the EEClass are allocated on the loader heaps of the SharedDomain. Loader heaps are AppDomain-specific and any data structures already mentioned here, once loaded, will not go away until an AppDomain is unloaded. Also, the default AppDomain can't be unloaded and hence the code lives until the CLR is shut down.
ObjectInstance
As we mentioned, all instances of value types are either inlined on the thread stack or inlined on the GC Heap. All reference types are created on the GC Heap or LOH. Figure 6 shows a typical object instance layout. An object can be referenced from stack-based local variables, handle tables in the interop or P/Invoke scenarios, from registers (the this pointer and method arguments while executing a method), or from the finalizer queue for objects having finalizer methods. The OBJECTREF does not point to the beginning of the Object Instance but at a DWORD offset (4 bytes). The DWORD is called Object Header and holds an index (a 1-based syncblk number) into a SyncTableEntry table. As the chaining is through an index, the CLR can move the table around in memory while increasing the size as needed. The SyncTableEntry maintains a weak reference back to the object so that the SyncBlock ownership can be tracked by the CLR. Weak references enable the GC to collect the object when no other strong references exist. SyncTableEntry also stores a pointer to SyncBlock that contains useful information, but is rarely needed by all instances of an object. This information includes the object's lock, its hash code, any thunking data, and its AppDomain index. For most object instances, there will be no storage allocated for the actual SyncBlock and the syncblk number will be zero. This will change when the execution thread hits statements like lock(obj) or obj.GetHashCode, as shown here:
SmallClass obj = new SmallClass() // Do some work here lock(obj) { /* Do some synchronized work here */ } obj.GetHashCode();
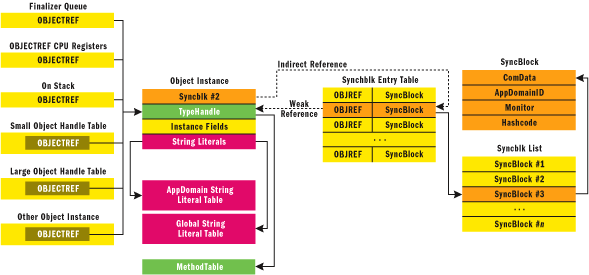
Figure 6** Object Instance Layout **
In this code, smallObj will use zero (no syncblk) as its starting syncblk number. The lock statement causes the CLR to create a syncblk entry and update the object header with the corresponding number. As the C# lock keyword expands to a try-finally that makes use of the Monitor class, a Monitor object is created on the syncblk for synchronization. A call to the GetHashCode method populates the syncblk with the object hash code.
There are other fields in the SyncBlock that are used in COM interop and for marshaling delegates to unmanaged code, but which are not relevant for a typical object usage.
TypeHandle follows the syncblk number in the ObjectInstance. In order to maintain continuity, I will discuss TypeHandle after elaborating on the instances variables. A variable list of instance fields follows the TypeHandle. By default, the instance fields will be packed in such a way that memory is used efficiently and padding is minimized for alignment. The code in Figure 7 shows a SimpleClass that has a bunch of instance variables with varying sizes contained in it.
Figure 7 SimpleClass with Instance Variables
class SimpleClass { private byte b1 = 1; // 1 byte private byte b2 = 2; // 1 byte private byte b3 = 3; // 1 byte private byte b4 = 4; // 1 byte private char c1 = 'A'; // 2 bytes private char c2 = 'B'; // 2 bytes private short s1 = 11; // 2 bytes private short s2 = 12; // 2 bytes private int i1 = 21; // 4 bytes private long l1 = 31; // 8 bytes private string str = "MyString"; // 4 bytes (only OBJECTREF) //Total instance variable size = 28 bytes static void Main() { SimpleClass simpleObj = new SimpleClass(); return; } }
Figure 8 shows an example of a SimpleClass object instance in the Visual Studio debugger memory window. We set a breakpoint on the return statement in Figure 7 and used the address of the simpleObj contained in the ECX register to display object instance in the memory window. The first 4-byte block is the syncblk number. As we didn't use the instance in any synchronizing code (or access its HashCode), this is set to 0. The object reference, as stored in the stack variable, points to 4 bytes starting at offset 4. The Byte variables b1, b2, b3, and b4 are all packed side by side. Both of the short variables, s1 and s2, are packed together. The String variable str is a 4-byte OBJECTREF that points to the actual instance of the string located on the GC Heap. String is a special type in that all instances containing the same literal will be made to point to the same instance in a global string table during the assembly loading process. This process is called string interning and is designed to optimize memory usage. As we mentioned previously, in the .NET Framework 1.1, an assembly cannot opt out of this interning process, although future versions of CLR may provide this capability.

Figure 8** Debugger Memory Window for Object Instance**
So the lexical sequence of member variables in the source code is not maintained in memory by default. In interop scenarios where lexical sequence has to be carried forward into memory, the StructLayoutAttribute can be used, which takes a LayoutKind enumeration as the argument. LayoutKind.Sequential will maintain the lexical sequence for the marshaled data, though in the .NET Framework 1.1 it will not affect the managed layout (however, in the .NET Framework 2.0, it will). In interop scenarios where you really need to have extra padding and explicit control of the field sequence, LayoutKind.Explicit can be combined with FieldOffset decoration at the field level.
Having looked at the raw memory contents, let's use SOS to look at the object instance. One useful command is DumpHeap, which allows listing of all the heap contents and all the instances of a particular type. Instead of relying on the registers, DumpHeap can show the address of the only instance we created:
!DumpHeap -type SimpleClass Loaded Son of Strike data table version 5 from "C:\WINDOWS\Microsoft.NET\Framework\v1.1.4322\mscorwks.dll" Address MT Size 00a8197c 00955124 36 Last good object: 00a819a0 total 1 objects Statistics: MT Count TotalSize Class Name 955124 1 36 SimpleClass
The total size of the object is 36 bytes. No matter how large the string is, instances of SimpleClass contain only DWORD OBJECTREF. SimpleClass's instance variables only occupy 28 bytes. The remaining 8 bytes are comprised of the TypeHandle (4 bytes) and the syncblk number (4 bytes). Having found the address of the instance simpleObj, let's dump the contents of this instance using the DumpObj command, as shown here:
!DumpObj 0x00a8197c Name: SimpleClass MethodTable 0x00955124 EEClass 0x02ca33b0 Size 36(0x24) bytes FieldDesc*: 00955064 MT Field Offset Type Attr Value Name 00955124 400000a 4 System.Int64 instance 31 l1 00955124 400000b c CLASS instance 00a819a0 str << some fields omitted from the display for brevity >> 00955124 4000003 1e System.Byte instance 3 b3 00955124 4000004 1f System.Byte instance 4 b4
As noted, the default layout generated for classes by the C# compiler is LayoutType.Auto (for structs, LayoutType.Sequential is used); hence the class loader rearranged the instance fields to minimize the padding. We can use ObjSize to dump the graph that includes the space taken up by the instance, str. Here's the output:
!ObjSize 0x00a8197c sizeof(00a8197c) = 72 ( 0x48) bytes (SimpleClass)
Son of Strike
The SOS debugger extension is used to display the contents of CLR data structures in this article. It's part of the .NET Framework installation and is located at %windir%\Microsoft.NET\Framework\v1.1.4322. Before you load SOS into the process, enable managed debugging from the project properties in Visual Studio .NET. Add the directory in which SOS.dll is located to the PATH environment variable. To load SOS.dll, while at a breakpoint, open Debug | Windows | Immediate. In the immediate window, execute .load sos.dll. Use !help to get a list of debugger commands. For more information on SOS, see the June 2004 Bugslayer column.
If you subtract the size of the SimpleClass instance (36 bytes) from the overall size of the object graph (72 bytes), you should get the size of the str—that is, 36 bytes. Let's verify this by dumping the str instance. Here's the output:
!DumpObj 0x00a819a0 Name: System.String MethodTable 0x009742d8 EEClass 0x02c4c6c4 Size 36(0x24) bytes
If you add the size of the string instance str (36 bytes) to the size of SimpleClass instance (36 bytes), you get a total size of 72 bytes, as reported by the ObjSize command.
Note that ObjSize will not include the memory taken up by the syncblk infrastructure. Also, in the .NET Framework 1.1, the CLR is not aware of the memory taken up by any unmanaged resources like GDI objects, COM objects, file handles, and so on; hence, they will not be reported by this command.
TypeHandle, a pointer to the MethodTable, is located right after the syncblk number. Before an object instance is created, the CLR looks up the loaded types, loads the type if not found, obtains the MethodTable address, creates the object instance, and populates the object instance with the TypeHandle value. The JIT compiler-generated code uses TypeHandle to locate the MethodTable for method dispatching. The CLR uses TypeHandle whenever it has to backtrack to the loaded type through MethodTable.
MethodTable
Each class and interface, when loaded into an AppDomain, will be represented in memory by a MethodTable data structure. This is a result of the class-loading activity before the first instance of the object is ever created. While ObjectInstance represents the state, MethodTable represents the behavior. MethodTable binds the object instance to the language compiler-generated memory-mapped metadata structures through EEClass. The information in the MethodTable and the data structures hanging off it can be accessed from managed code through System.Type. A pointer to the MethodTable can be acquired even in managed code through the Type.RuntimeTypeHandle property. TypeHandle, which is contained in the ObjectInstance, points to an offset from the beginning of the MethodTable. This offset is 12 bytes by default and contains GC information which we will not discuss here.
Figure 9 shows the typical layout of the MethodTable. We'll show some of the important fields of the TypeHandle, but for a more complete list, look at the figure. Let's start with the Base Instance Size as it has direct correlation to the runtime memory profile.
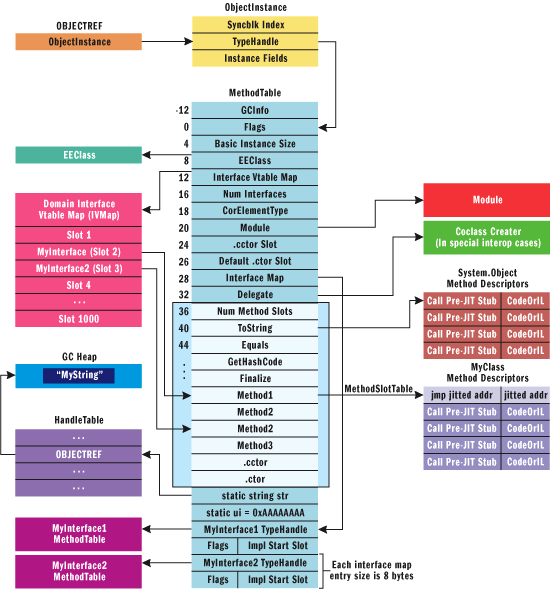
Figure 9** MethodTable Layout**
Base Instance Size
The Base Instance Size is the size of the object as computed by the class loader, based on the field declarations in the code. As discussed previously, the current GC implementation needs an object instance of at least 12 bytes. If a class does not have any instance fields defined, it will carry an overhead of 4 bytes. The rest of the 8 bytes will be taken up by the Object Header (which may contain a syncblk number) and TypeHandle. Again, the size of the object can be influenced by a StructLayoutAttribute.
Look at the memory snapshot (Visual Studio .NET 2003 memory window) of a MethodTable for MyClass from Figure 3 (MyClass with two interfaces) and compare it with SOS-generated output. In Figure 9, the object size is located at a 4-byte offset and the value is 12 (0x0000000C) bytes. The following is the output of DumpHeap from SOS:
!DumpHeap -type MyClass Address MT Size 00a819ac 009552a0 12 total 1 objects Statistics: MT Count TotalSize Class Name 9552a0 1 12 MyClass
Method Slot Table
Embedded within the MethodTable is a table of slots that point to the respective method descriptors (MethodDesc), enabling the behavior of the type. The Method Slot Table is created based on the linearized list of implementation methods laid out in the following order: Inherited virtuals, Introduced virtuals, Instance Methods, and Static Methods.
The ClassLoader walks through the metadata of the current class, parent class, and interfaces, and creates the method table. In the layout process, it replaces any overridden virtual methods, replaces any parent class methods being hidden, creates new slots, and duplicates slots as necessary. The duplication of slots is necessary to create an illusion that each interface has its own mini vtable. However, the duplicated slots point to the same physical implementation. MyClass has three instance methods, a class constructor (.cctor), and an object constructor (.ctor). The object constructor is automatically generated by the C# compiler for all objects having no constructors explicitly defined. Class constructor is generated by the compiler as we have a static variable defined and initialized. Figure 10 shows the layout of the method table for MyClass. The layout shows 10 methods because of the duplication of Method2 slot for IVMap, which will be covered next. Figure 11 shows the edited SOS dump of MyClass's method table.
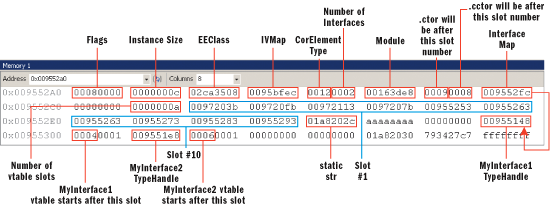
Figure 10** MyClass MethodTable Layout**
Figure 11 SOS Dump of MyClass Method Table
!DumpMT -MD 0x9552a0 Entry MethodDesc Return Type Name 0097203b 00972040 String System.Object.ToString() 009720fb 00972100 Boolean System.Object.Equals(Object) 00972113 00972118 I4 System.Object.GetHashCode() 0097207b 00972080 Void System.Object.Finalize() 00955253 00955258 Void MyClass.Method1() 00955263 00955268 Void MyClass.Method2() 00955263 00955268 Void MyClass.Method2() 00955273 00955278 Void MyClass.Method3() 00955283 00955288 Void MyClass..cctor() 00955293 00955298 Void MyClass..ctor()
The first four methods of any type will always be ToString, Equals, GetHashCode, and Finalize. These are virtual methods inherited from System.Object. The Method2 slot is duplicated, but both point to the same method descriptor. The explicitly coded .cctor and .ctor will be grouped with static methods and instance methods, respectively.
MethodDesc
Method Descriptor (MethodDesc) is an encapsulation of method implementation as the CLR knows it. There are several types of Method Descriptors that facilitate the calls to a variety of interop implementations, in addition to managed implementations. In this article we will only look at the managed MethodDesc in the context of the code shown in Figure 3. A MethodDesc is generated as a part of the class loading process and initially points to Intermediate Language (IL). Each MethodDesc is padded with a PreJitStub, which is responsible for triggering JIT compilation. Figure 12 shows a typical layout. The method table slot entry actually points to the stub instead of the actual MethodDesc data structure. This is at a negative offset of 5 bytes from the actual MethodDesc and is part of the 8-byte padding every method inherits. The 5 bytes contain instructions for a call to the PreJitStub routine. This 5-byte offset can be seen from the DumpMT output (of MyClass in Figure 11) of SOS, as MethodDesc is always 5 bytes after the location pointed to by the Method Slot Table entry. Upon the first invocation, a call to the JIT compilation routine is made. After the compilation is complete, the 5 bytes containing the call instruction will be overwritten with an unconditional jump to the JIT-compiled x86 code.
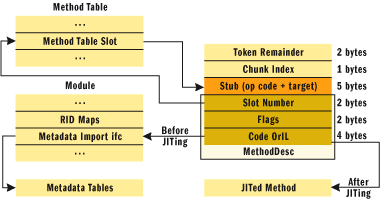
Figure 12** Method Descriptor **
Disassembly of the code pointed to by the Method Table Slot entry in Figure 12 will show the call to the PreJitStub. Here's an abridged display of the disassembly before JIT for Method 2:
!u 0x00955263 Unmanaged code 00955263 call 003C3538 ;call to the jitted Method2() 00955268 add eax,68040000h ;ignore this and the rest ;as !u thinks it as code
Now let's execute the method and disassemble the same address:
!u 0x00955263 Unmanaged code 00955263 jmp 02C633E8 ;call to the jitted Method2() 00955268 add eax,0E8040000h ;ignore this and the rest ;as !u thinks it as code
Only the first 5 bytes at the address is code; the rest contains data of Method2's MethodDesc. The "!u" command is unaware of this and generates gibberish, so you can ignore anything after the first 5 bytes.
CodeOrIL before JIT compilation contains the Relative Virtual Address (RVA) of the method implementation in IL. This field is flagged to indicate that it is IL. The CLR updates this field with the address of the JITed code after on-demand compilation. Let's pick a method from the ones listed and dump the MethodDesc using DumpMT command before and after JIT compilation:
!DumpMD 0x00955268 Method Name : [DEFAULT] [hasThis] Void MyClass.Method2() MethodTable 9552a0 Module: 164008 mdToken: 06000006 Flags : 400 IL RVA : 00002068
After compilation, MethodDesc looks like this:
!DumpMD 0x00955268 Method Name : [DEFAULT] [hasThis] Void MyClass.Method2() MethodTable 9552a0 Module: 164008 mdToken: 06000006 Flags : 400 Method VA : 02c633e8
The Flags field in the method descriptor is encoded to contain the information about the type of the method, such as static, instance, interface method, or COM implementation.
Let's see another complicated aspect of MethodTable: Interface implementation. It's made to look simple to the managed environment by absorbing all the complexity into the layout process. Next, we'll show how the interfaces are laid out and how interface-based method dispatching really works.
Interface Vtable Map and Interface Map
At offset 12 in the MethodTable is an important pointer, the IVMap. As shown in Figure 9, IVMap points to an AppDomain-level mapping table that is indexed by a process-level interface ID. The interface ID is generated when the interface type is first loaded. Each interface implementation will have an entry in IVMap. If MyInterface1 is implemented by two classes, there will be two entries in the IVMap table. The entry will point back to the beginning of the sub-table embedded within the MyClass method table, as shown in Figure 9. This is the reference with which the interface-based method dispatching occurs. IVMap is created based on the Interface Map information embedded within the method table. Interface Map is created based on the metadata of the class during the MethodTable layout process. Once typeloading is complete, only IVMap is used in method dispatching.
The Interface Map at offset 28 will point to the InterfaceInfo entries embedded within the MethodTable. In this case, there are two entries for each of the two interfaces implemented by MyClass. The first 4 bytes of the first InterfaceInfo entry points to the TypeHandle of MyInterface1 (see Figure 9 and Figure 10). The next WORD (2 bytes) is taken up by Flags (where 0 is inherited from parent, and 1 is implemented in the current class). The WORD right after Flags is Start Slot, which is used by the class loader to lay out the interface implementation sub-table. For MyInterface1, the value is 4, which means that slots 5 and 6 point to the implementation. For MyInterface2, the value is 6, so slots 7 and 8 point to the implementation. ClassLoader duplicates the slots if necessary to create the illusion that each interface gets its own implementation while physically mapping to the same method descriptor. In MyClass, MyInterface1.Method2 and MyInterface2.Method2 will point to the same implementation.
Interface-based method dispatching occurs through IVMap, while direct method dispatch occurs through the MethodDesc address stored at the respective slot. As mentioned earlier, the .NET Framework uses the fastcall calling convention. The first two arguments are typically passed through ECX and EDX registers, if possible. This first argument of the instance method is always a this pointer, which is passed through the ECX register as shown by the "mov ecx, esi" statement:
mi1.Method1(); mov ecx,edi ;move "this" pointer into ecx mov eax,dword ptr [ecx] ;move "TypeHandle" into eax mov eax,dword ptr [eax+0Ch] ;move IVMap address into eax at offset 12 mov eax,dword ptr [eax+30h] ;move the ifc impl start slot into eax call dword ptr [eax] ;call Method1 mc.Method1(); mov ecx,esi ;move "this" pointer into ecx cmp dword ptr [ecx],ecx ;compare and set flags call dword ptr ds:[009552D8h];directly call Method1
These disassemblies show that the direct call to MyClass's instance method does not use offset. The JIT compiler writes the address of the MethodDesc directly into the code. Interface-based dispatch happens through IVMap and requires a few extra instructions than the direct dispatch. One is used to fetch the address of the IVMap, and the other to fetch the start slot of the interface implementation within the Method SlotTable. Also, casting an object instance to an interface merely copies the this pointer to the target variable. In Figure 2, the statement "mi1 = mc;" uses a single instruction to copy the OBJECTREF in mc to mi1.
Virtual Dispatch
Let's look now at Virtual Dispatch and compare it with direct and interface-based dispatch. Here is the disassembly for a virtual method call to MyClass.Method3 from Figure 3:
mc.Method3(); Mov ecx,esi ;move "this" pointer into ecx Mov eax,dword ptr [ecx] ;acquire the MethodTable address Call dword ptr [eax+44h] ;dispatch to the method at offset 0x44
Virtual dispatch always occurs through a fixed slot number, irrespective of the MethodTable pointer in a given implementation class (type) hierarchy. During the MethodTable layout, ClassLoader replaces the parent implementation with the overriding child implementation. As a result, method calls coded against the parent object get dispatched to the child object's implementation. The disassembly shows that the dispatch occurs through slot number 8 in the debugger memory window (as seen in Figure 10) as well as the DumpMT output.
Static Variables
Static variables are an important constituent part of the MethodTable data structure. They are allocated as a part of the MethodTable right after the method table slot array. All the primitive static types are inlined while the static value objects like structs and reference types are referred through OBJECTREFs created in the handle tables. OBJECTREF in the MethodTable refers to OBJECTREF in the AppDomain handle table, which refers to the heap-created object instance. Once created, OBJECTREF in the handle table will keep the object instance on the heap alive until the AppDomain is unloaded. In Figure 9, a static string variable, str, points to OBJECTREF on the handle table, which points to MyString on the GC Heap.
EEClass
EEClass comes to life before the MethodTable is created and, when combined with MethodTable, is the CLR version of a type declaration. In fact, EEClass and MethodTable are logically one data structure (together they represent a single type), and were split based on frequency of use. Fields that get used a lot are in MethodTable, while fields that get used infrequently are in EEClass. Thus information (like names, fields, and offsets) needed to JIT compile functions end up in EEClass, however info needed at run time (like vtable slots and GC information) are in MethodTable.
There will be one EEClass for each type loaded into an AppDomain. This includes interface, class, abstract class, array, and struct. Each EEClass is a node of a tree tracked by the execution engine. CLR uses this network to navigate through the EEClass structures for purposes including class loading, MethodTable layout, type verification, and type casting. The child-parent relationship between EEClasses is established based on the inheritance hierarchy, whereas parent-child relationships are established based on the combination of inheritance hierarchy and class loading sequence. New EEClass nodes get added, node relationships get patched, and new relationships get established as the execution of the managed code progresses. There is also a horizontal relationship with sibling EEClasses in the network. EEClass has three fields to manage the node relationships between loaded types: ParentClass, SiblingChain, and ChildrenChain. Refer to Figure 13 for the schematics of EEClass in the context of MyClass from Figure 4.
Figure 13 shows only a few of the fields relevant to this discussion. Because we've omitted some fields in the layout, we have not really shown the offsets in this figure. EEClass has a circular reference to MethodTable. EEClass also points MethodDesc chunks allocated on HighFrequencyHeap of the default AppDomain. A reference to a list of FieldDesc objects allocated on the process heap provides field layout information during MethodTable construction. EEClass is allocated on the LowFrequencyHeap of the AppDomain so that the operating system can better perform page management of memory, thereby reducing the working set.
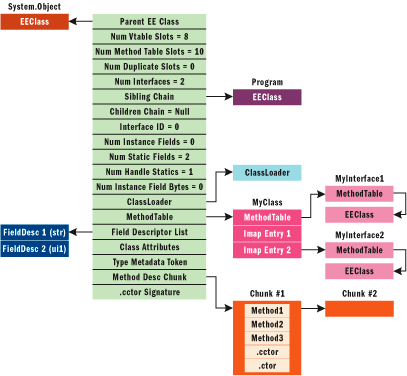
Figure 13** EEClass Layout **
Other fields shown in Figure 13 are self-explanatory in the context of MyClass (Figure 3). Let's look now at the real physical memory by dumping the EEClass using SOS. Run the program from Figure 3 after setting a breakpoint on the line, mc.Method1. First obtain the address of EEClass for MyClass using the command Name2EE:
!Name2EE C:\Working\test\ClrInternals\Sample1.exe MyClass MethodTable: 009552a0 EEClass: 02ca3508 Name: MyClass
The first argument to Name2EE is the module name that can be obtained from DumpDomain command. Now that we have the address of the EEClass, we'll dump the EEClass itself:
!DumpClass 02ca3508 Class Name : MyClass, mdToken : 02000004, Parent Class : 02c4c3e4 ClassLoader : 00163ad8, Method Table : 009552a0, Vtable Slots : 8 Total Method Slots : a, NumInstanceFields: 0, NumStaticFields: 2,FieldDesc*: 00955224 MT Field Offset Type Attr Value Name 009552a0 4000001 2c CLASS static 00a8198c str 009552a0 4000002 30 System.UInt32 static aaaaaaaa ui
Figure 13 and the DumpClass output look essentially the same. Metadata token (mdToken) represents the MyClass index in the memory mapped metadata tables of the module PE file, and the Parent class points to System.Object. Sibling Chain (Figure 13) shows that it is loaded as a result of the loading of the Program class.
MyClass has eight vtable slots (methods that can be virtually dispatched). Even though Method1 and Method2 are not virtual, they will be considered virtual methods when dispatched through interfaces and added to the list. Add .cctor and .ctor to the list, and you get 10 (0?a) total methods. The class has two static fields that are listed at the end. MyClass has no instance fields. The rest of the fields are self-explanatory.
Conclusion
That concludes our tour of the some of the most important internals of the CLR. Obviously, there's much more to be covered, and in much more depth, but we hope this has given you a glimpse into how things work. Much of the information presented here will likely change with subsequent releases of the CLR and the .NET Framework. But although the CLR data structures covered in this article may change, the concepts should remain the same.
Hanu Kommalapati is an Architect at Microsoft Gulf Coast District (Houston). In his current role at Microsoft, he helps enterprise customers in building scalable component frameworks based on the .NET Framework. He can be reached at hanuk@microsoft.com.
Tom Christian is an Escalation Engineer with Developer Support at Microsoft, working with ASP.NET and the .NET debugger extension for WinDBG (sos/psscor). He is based in Charlotte, NC and can be contacted at tomchris@microsoft.com.