Windows With C++
X64 Debugging With Pseudo Variables And Format Specifiers
Kenny Kerr
Contents
Processor Architectures
Pseudo Variables
Format Specifiers
Visualizing Calling Conventions
Error Codes
Debugging the Security Context
For many years, Visual C++ has included a set of pseudo variables and format specifiers for use in debugging. By pseudo variables I mean terms that you can enter into a debugger watch window to have it display some value that doesn't necessarily relate to any C++ variable. Unfortunately, pseudo variables have never been well documented. Although I don't have enough insider information to document them myself, I want to share some of the pseudo variables and format specifiers that I've found most useful. I hope the discussion will inspire you to read up on the subject.
Before I introduce pseudo variables (which are sometimes called pseudo registers), I need to say a word about processor architectures and registers, because a little bit of background can make pseudo variables a lot more valuable. It will also help you understand one way the 64-bit versions of your application differ from traditional 32-bit applications. As this column is more about Visual C++ than about the smallest details of processor architecture, I'm going to limit this discussion to the x86 and x64 processor architectures. You can learn more about the differences introduced by the Itanium processor by reading the documentation in the MSDN library.
Processor Architectures
Processor architectures aren't very easy for mere mortals to fully comprehend. That's why the C language and its successors made such an impact on the software industry. At the very least, you should have an idea of what the x86 and x64 processor architectures represent, as they are the processors the vast majority of users own. Windows and Visual C++ also support the Itanium processor, but very few developers have the luxury of targeting it.
For better or worse, x86 has dominated over the last few decades with its roots in the 8-bit Intel 8080 processor. AMD and Intel made a pragmatic choice with x64 in order to retain backward compatibility with x86. Itanium, on the other hand, introduced a powerful new architecture that isn't restricted by the legacy of x86. Of course, far fewer applications are supported as a result, but it is a testament to David Cutler (who led the development of Windows NT) and his vision of a portable operating system that Windows has been able to adopt new architectures so relatively painlessly over the years.
Although many of the differences between the processor architectures are hidden behind the C++ compiler, one that developers can clearly see a benefit from is the move to a single calling convention. The x64 version of the C++ compiler only supports a single calling convention, whereas the x86 compiler supports a handful. This is a welcome change, as it eliminates many of the potential bugs introduced by a mismatch of calling conventions, particularly in managed code interop where the Microsoft .NET Framework compilers, such as C# and Visual Basic .NET, cannot check the original calling conventions in the C++ header files. Instead, they must rely on handcrafted attributes, which can easily be defined incorrectly, leading to various stack corruption bugs.
The ecx register, for example, is used by the native C++ calling convention, known as thiscall, to store the "this" pointer before a member function is called. This knowledge is useful for debugging but is dependent on the calling convention, which may not be obvious just by looking at some assembler code and register values. This is far simpler on x64 as the "this" pointer is always inserted as the first parameter and thus stored in the rcx register.
Naturally, using registers in debugging is very processor specific, but fortunately the relationship between x86 and x64 can be exploited. The x86 architecture introduced the concept of sub-registers where a sub-register consisted of the lower half of its super-register. For example, ax is a 16-bit sub-register consisting of the lower half of the eax register. The x64 architecture extends this by providing 64-bit registers that supersede the 32-bit x86 registers. For example, on x64 eax is a 32-bit sub-register consisting of the lower half of the 64-bit rax register. Both eax and rax are interesting, as they are used by x86 and x64, respectively, for pointers or integers returned by a function. Naturally, for a function running on x86 to return a 64-bit value it needs to use a pair of registers.
Pseudo Variables
Probably the most common pseudo variable is $err, which displays the last error value set with the function SetLastError. The value that is displayed represents what would be returned by the GetLastError function.
Pseudo variables can also be used to display the value of a processor register. For example, $ecx displays the value of the ecx register from the x86 architecture. Looking at the values of processor registers might seem a bit enigmatic to the new generation of developers using .NET, but it can really help in diagnosing obscure bugs or just understanding a program's behavior at run time. You can use $ecx to display the address of the "this" pointer, assuming you're using the native C++ calling convention on x86. You can also use $eax to display a 32-bit return value on both architectures. There are many more registers that may come in handy depending on your debugging needs.
Other useful pseudo variables include $handles, which displays the number of open handles to kernel objects in the process, and $user, which displays very detailed information about the current process and thread tokens. The latter can be useful for debugging impersonation-related code. Figure 1 lists some common pseudo variables.
Figure 1 Pseudo Variables
| Pseudo Variable | Description |
|---|---|
| $handles | Number of handles to kernel objects |
| $vframe | Current stack frame address |
| $TID | Current thread identifier |
| $registername | Contents of specified register |
| $clk | Time in clock cycles |
| $user | Process and thread token information |
Format Specifiers
Format specifiers come in handy when you want to change the way a watch window displays the value of a variable, pseudo variable, or expression. In most cases, the watch window will figure out the best format for the value based on its type, but there are cases when you might need to override this. The debugger might not be able to deduce the type of variable, or you might just have a memory address that naturally has no type information. For example, the hr format specifier will display the Win32 or HRESULT corresponding to the value. Other examples include su, which will display the value as a null terminated Unicode string.
Of course, you might want to get at the actual value behind some formatted text and ! will do just that. Finally, given a pointer, you can force the watch window to treat it as an array of n elements using a comma followed by the number of elements to display. Figure 2 lists format specifiers.
Figure 2 Format Specifiers
| Specifier | Description |
|---|---|
| D | Decimal |
| U | Unsigned decimal |
| O | Octal |
| X | Hexadecimal |
| F | Floating point |
| E | Scientific notation |
| C | Character |
| S | Character string |
| Su | Unicode string |
| s8 | UTF-8 string |
| Hr | HRESULT or Win32 error code |
| wc | Windows class |
| wm | Windows message |
| ! | Raw format |
Visualizing Calling Conventions
With that background information out of the way, let's take a look at a few examples. Consider the snippet below. The x86 compiler defaults to the __thiscall calling convention for member functions. This indicates that the parameters are pushed onto the stack and the "this" pointer is stored in the ecx register:
struct Sample
{
    size_t m;
    Sample() : m(0x11223344) {}

    size_t Method(size_t p1, size_t p2)
    {
        return 0x44556677;
    }
};
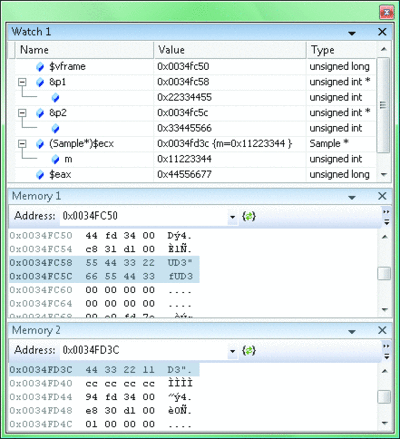
Figure 3 illustrates this and more. The watch window displays interesting variables. $vframe provides the address of the current stack frame. This pseudo variable provides a processor-neutral way of getting the address of the stack frame. Next are the addresses of the two parameters. Their values are 0x22334455 and 0x33445566.

Figure 3 32-Bit Stack and Registers (Click the image for a larger view)
The first memory window also displays the current stack frame; you can see the values of these parameters on the stack. Next is the ecx register; I've cast it as a pointer to a Sample to display the members of the object. The second memory window also displays the object in memory; you can see the member variable farther down in the stack. Next, the $eax variable displays the value of the register that is storing the result of the function call.
The same C++ code compiled by the x64 compiler produces noticeably different results. The compiler takes advantage of the increased number of registers available on x64 and uses them heavily to avoid pushing values on the stack unnecessarily. Specifically, the first four pointer or integer parameters are placed in the rcx, rdx, r8, and r9 registers, respectively. For member functions, the "this" pointer is treated as the first parameter. Space is reserved in case the function needs to save any parameters to the stack temporarily. Finally, any pointer or integer result is returned in the rax register.
Figure 4 illustrates this. Again, $vframe displays the address of the current stack frame. This time you can see that the values are all 64 bits. Next are the addresses of the two parameters. Though the parameters were passed with registers to the called function, these parameters are in the current stack frame. This is a debug build. The function saved the parameters to the stack. The next three variables, $rcx, $r8, and $rdx, provide the values of the three parameters, including the prepended "this" pointer. Finally, $rax displays the value of the register that's storing the result of the function call.

Figure 4 64-Bit Stack and Registers (Click the image for a larger view)
Error Codes
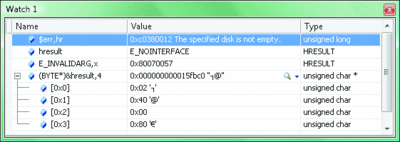
Pseudo variables and format specifiers are also very useful for looking at error codes in various forms and locations. Figure 5 lists a few examples, such as $err,hr, which provides the value and description for the last error code. This equates to the ERROR_VOLMGR_DISK_NOT_EMPTY error code from the Volume Shadow Copy Service. The $err pseudo variable provides the value, and the hr format specifier tells the watch window to format it as an error code. Note also that hresult is a C++ variable, and the watch window automatically displays the well-known constant representing its value. E_INVALIDARG,x shows how you can override the automatic formatting. In this case the x format specifier instructs the watch window to display it as a hexadecimal value. The last example shows how you can turn almost any address into an array.

Figure 5 Error Codes (Click the image for a larger view)
Debugging the Security Context
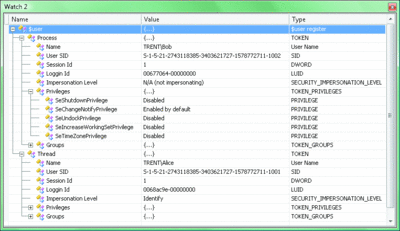
Figure 6 shows the impressive $user pseudo variable. You can see that Bob is impersonating Alice! This pseudo variable provides much detail about both the process and thread tokens and is handy when debugging impersonation issues in client/server applications.

Figure 6 The $user Pseudo Variable (Click the image for a larger view)
There are more tricks you can use in the Visual Studio watch windows and a handful for debugging C# code. Plus, the Debugging Tools for Windows have an extensive set of pseudo variables. And for more debugging tips, see Advanced Windows Debugging.
Send your questions and comments to mmwincpp@microsoft.com.
Kenny Kerr is a software craftsman specializing in software development for Windows. He has a passion for writing and teaching developers about programming and software design. You can reach Kenny at weblogs.asp.net/kennykerr.