Note
Access to this page requires authorization. You can try signing in or changing directories.
Access to this page requires authorization. You can try changing directories.
Question
Monday, July 20, 2015 11:32 PM | 1 vote
I found this service performing questionable activities every time I launched the debugger in VS 2015 RTM:
"Visual Studio Standard Collector Service"
aka "Microsoft Visual Studio 14.0\Team Tools\DiagnosticsHub\Collector\StandardCollector.Service.exe"
So I went into local services.msc and disabled it. I don't remember it being a component of the previous versions of VS.
(Note : I had already opted out of the "Visual Studio Experience Improvement Program", thinking that is what was "driving" the service, but it had no impact on the activities being performed by the service at debug time.)
Can anyone comment on the purpose of "Visual Studio Standard Collector Service"? Is it really for collecting real-time ETW events and processing them? Is there another way to avoid the activities it performs other than the "brute-force" disabling of the Windows service? (I was hoping there was an Option under "Tools->Options" but I've unchecked almost everything and it had little effect on the behavior of the "Visual Studio Standard Collector Service")
Any info would be appreciated.
Thanks in advance,
David
David Beavon
All replies (6)
Tuesday, July 21, 2015 8:38 AM | 1 vote
Hi David,
>>Visual Studio Standard Collector Service"
>>aka "Microsoft Visual Studio 14.0\Team Tools\DiagnosticsHub\Collector\StandardCollector.Service.exe"
Under Tools->Options->Debugging->General, disable "Enable Diagnostic Tools while debugging".
Tools->Options->IntelliTrace, uncheck "Enable IntelliTrace".
And then debug your app again. Please check your Service again. I doubt that it is related to the DiagnosticsHub tool.
Best Regards,
Jack
We are trying to better understand customer views on social support experience, so your participation in this interview project would be greatly appreciated if you have time. Thanks for helping make community forums a great place.
Click HERE to participate the survey.
Tuesday, July 21, 2015 12:50 PM
That did not seem to do the trick. The StandardCollector.Service.exe still runs and does its thing.
If you have procmon open you will see it is writing to %TEMP%. It creates a file called UserPagedMemory.1.etl when launching the debugger. I have disabled all the options I could find under Tools->Options and it still happens.
Maybe the "brute-force" approach (disabling of the Windows service) is the only way? It is odd that there seems to be no consequence either way for my debugging.
David Beavon
Wednesday, July 22, 2015 2:11 AM
Hi David,
Could you tell me the detailed steps about how you debug your app? Which kind of app did you debug?
Actually I doubt that the real issue is related to the profile tools under Debug->Start Diagnostic Tools Without Debugging...
For example, I create a WPF app, and then click Debug->Start Diagnostic Tools Without Debugging..., if I select the "CPU usage".
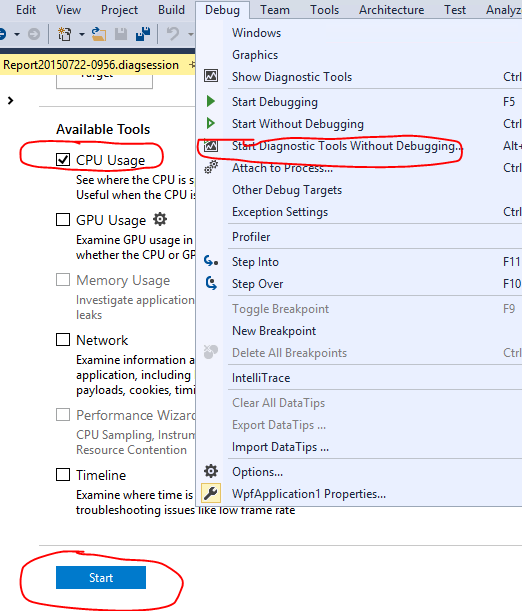
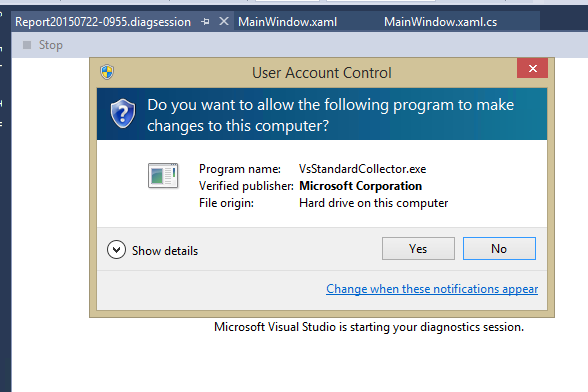
Click "Start". I would get the pop window about the "VsStandardCollector.exe" under the same path C:\Program Files (x86)\Microsoft Visual Studio 14.0\Team Tools\DiagnosticsHub\Collector.
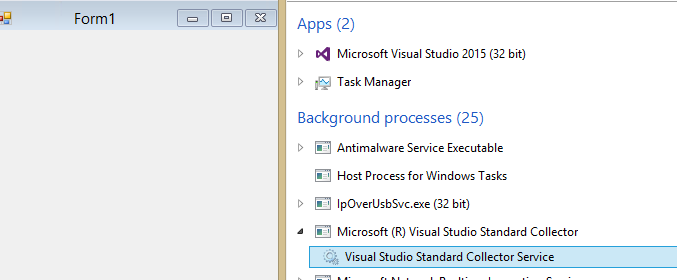
If I use "Memory" option in the first screen shot, Click "Start", I also could get the information like the screen shot 3. So I doubt that it is related to the profiler tools.
But if you use the profiler tool to collect the performance, we couldn't disable the process unless we just debug the app without using this tool.
Best Regards,
Jack
We are trying to better understand customer views on social support experience, so your participation in this interview project would be greatly appreciated if you have time. Thanks for helping make community forums a great place.
Click HERE to participate the survey.
Wednesday, July 22, 2015 2:10 PM
Thanks for the help. My app is winforms.
I use procmon to see what the service ("VsStandardCollector.exe" ) is doing and to identify the fact that it is involved at startup during debug.
I guess you convinced me that it isn't just related to debugging per se. Perhaps there is no way to avoid the participation of that component other than disabling it under "windows services". It seems like there should be a checkbox under VS options....
Thanks again. If you didn't find a checkbox for this, I'll assume there isn't one.
David
PS. I haven't quantified how much this delays the startup of my app during debug. It appears that it may be minimal. But I'm a bit trigger-happy and I find myself disabling all the additional "features" that VS 2015 added which slow down the launching of my debug sessions.... there are a number of them.
David Beavon
Thursday, July 23, 2015 3:35 AM
Hi David Beavon,
>>Thanks for the help. My app is winforms.
I test it with a simple Winforms app, I get the same issue as yours, actually if I debug the WPF app, I also get it.
I didn't get any settings which could disable this service in VS IDE. So I doubt that it would be have a limitation for us to really achieve it. I mean that it would start this service automatically if we debug an app.
If possible, you can submit this feedback to Microsoft Connect feedback portal: http://connect.microsoft.com/VisualStudio/feedback/CreateFeedback.aspx,Microsoft engineers will evaluate them seriously. If you submit it, please share me the link here, I will help you vote it.
Best Regards,
Jack
We are trying to better understand customer views on social support experience, so your participation in this interview project would be greatly appreciated if you have time. Thanks for helping make community forums a great place.
Click HERE to participate the survey.
Thursday, January 28, 2016 1:26 AM
Jack-Zhai - How did you mark this as answer? I don't see any solution provide????