Note
Access to this page requires authorization. You can try signing in or changing directories.
Access to this page requires authorization. You can try changing directories.
Introduction to Power BI
https://powerbi.microsoft.com/en-us/desktop/
Read this article to learn about the following in Power BI:
- Microsoft introduced a new tool for BI for these reasons
- So what is Power BI?
- Differences between Power BI and SharePoint BI
- Where can I download the Power BI and related products?
Power BI allows integration with various data sources like excel, SQL server, CSV, OData Feed, Blank Query, SSAS, Sybase, etc.
Scenario
In this article, let’s get the data from OData (Open Data Protocol) feeds and use the Power BI desktop software to design reports and publish it to Power BI site.
To learn more about what OData is and how to integrate, read the following articles:
- https://msdn.microsoft.com/en-us/data/hh237663.aspx
- https://support.office.com/en-us/article/Access-OData-Feeds-from-Power-Query-82BD48B9-6A2F-4F2A-83C9-6868BA1D30E2
- http://www.odata.org/
Creating Reports using OData Feed in Power BI
Open the Power BI desktop -> close the initial startup page -> click Get Data -> OData Feed
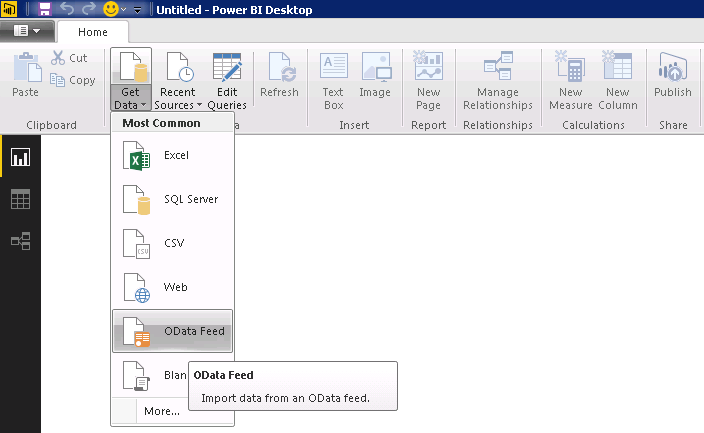
It will show open a popup window where you can enter the OData Feed URL as shown below:
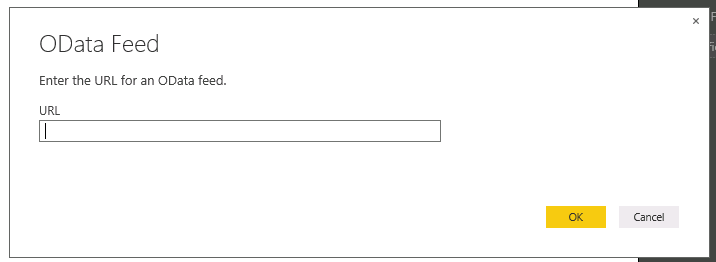
I have used the Adventure Works OData feed from Microsoft: http://services.odata.org/AdventureWorksV3/AdventureWorks.svc/
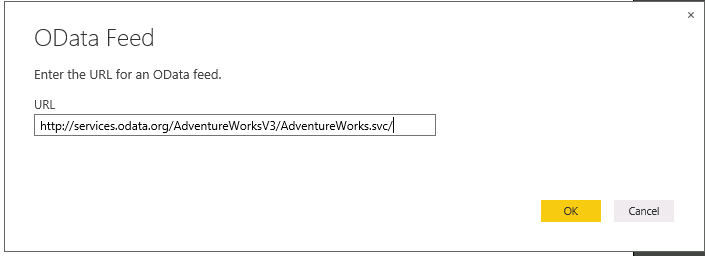
Enter the URL and click OK which will connect to the data and show the data in the tree view as shown below:
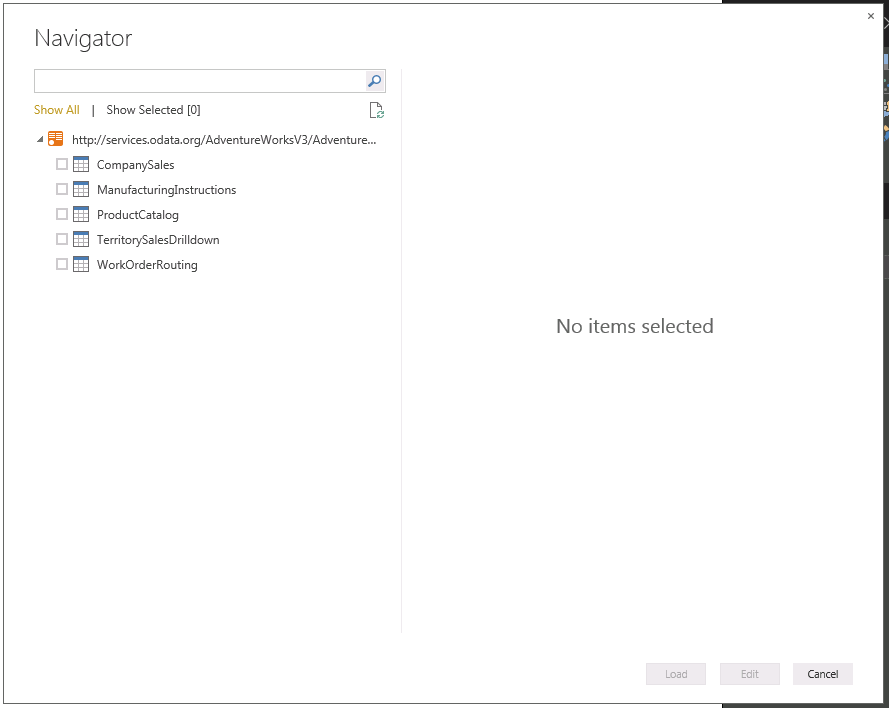
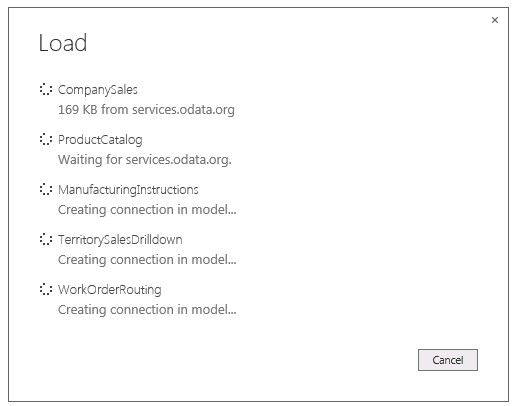
Select all the tables and click “Load” which will load the data, connection in model as shown below:

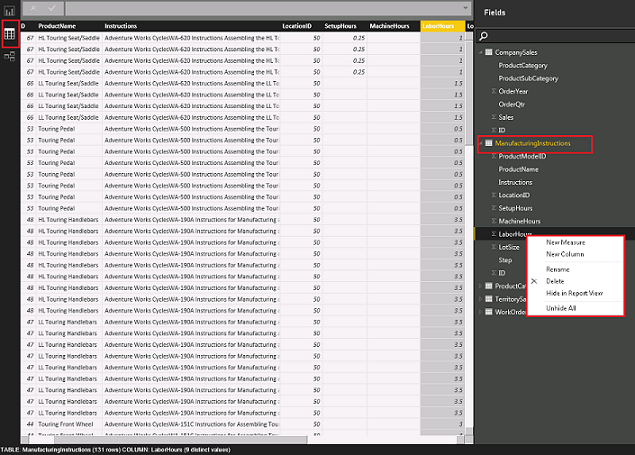
Once the data is loaded you can see the data and relationships icon in the left side of the designer is enabled. When you click the table icon, it will display the tabular view of all four tables selected from ODdata feed where you can create a new measure, new column, rename the columns, delete unwanted columns, hide columns from report view.
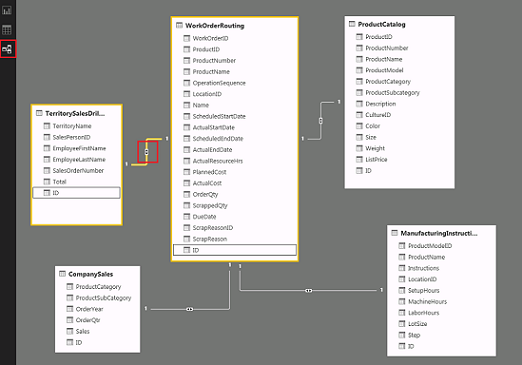
Relationships view will display the relationship between the tables. When you click on the small arrow between the tables, it will display the relationship between the tables. This also allows an option to create new relationships between the tables.
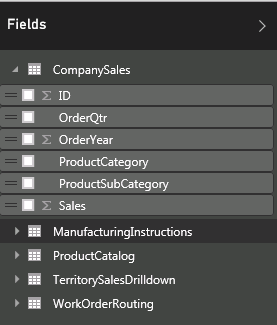
When you click on the report icon it will show all the four tables with its columns in the “Fields” section as shown below:
Now, it is time to create reports J
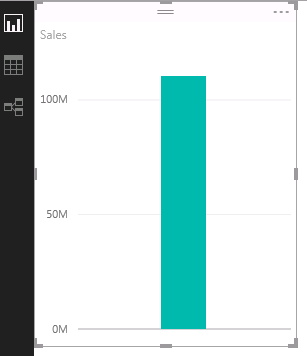
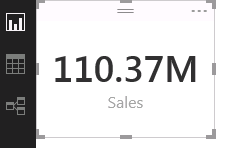
Drag the total sales column from the Company Sales table and insert into the report which will automatically create visualization as shown below. I have changed the visualization to Card type.
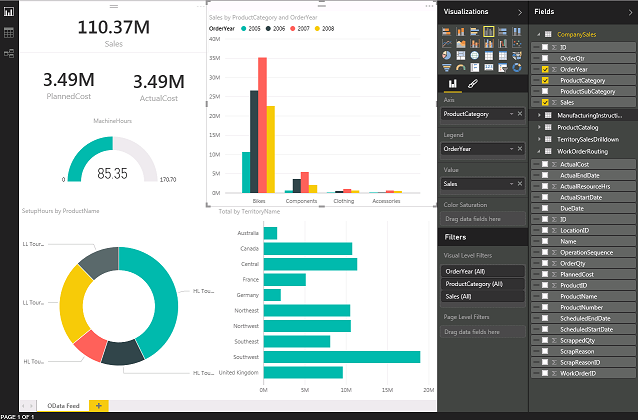
In the same way, I have added different shapes with different data representation. The final dashboard looks like as shown below:
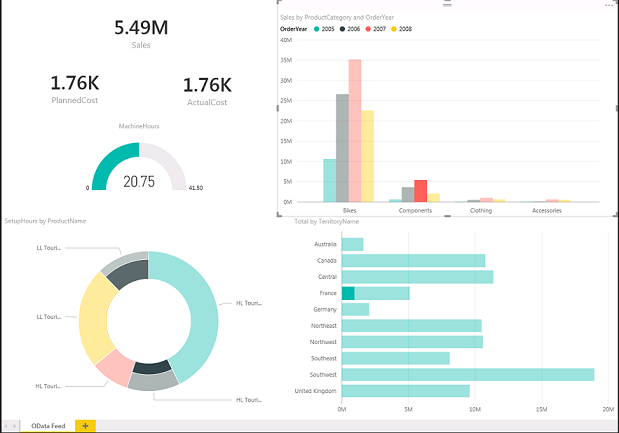
Let’s select components during the 2007 year and check how the other dashboards changes / data preview during that point of time:

Filtered report view:
Cool isn’t it?
Publish the report to Power BI site
Now, that we have created a report in Power BI designer, let’s go ahead and publish the report to Power BI site.
Microsoft has made the deployment easy that we can publish the report to Power BI by clicking the Publish button in the designer.
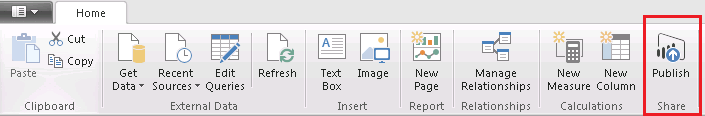
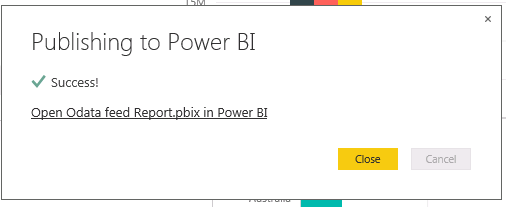
Click Publish -> You may have to sign in to Power BI online site (if you haven’t signed already)-> It will publish the report to Power BI site
The locally saved Power BI report (.pbix) will look like this:

I have attached the report file for reference. Report Download
Let’s login to the Power BI site and create Dashboards using the report published now. The report published will be added in the Reports Section of Power BI site as shown below:

Creating a Dashboard from Reports is very easy in Power BI. Basically, dashboards are the final views to the end users created by pinning different sections of the reports.
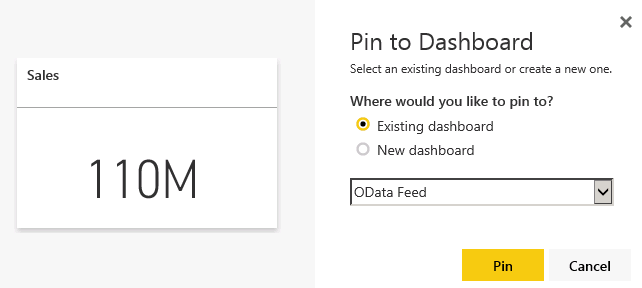
I have created a new dashboard named OData feed in the dashboard section. Click on the Pin Visual option in each section of report to pin the report section to dashboard as shown below:
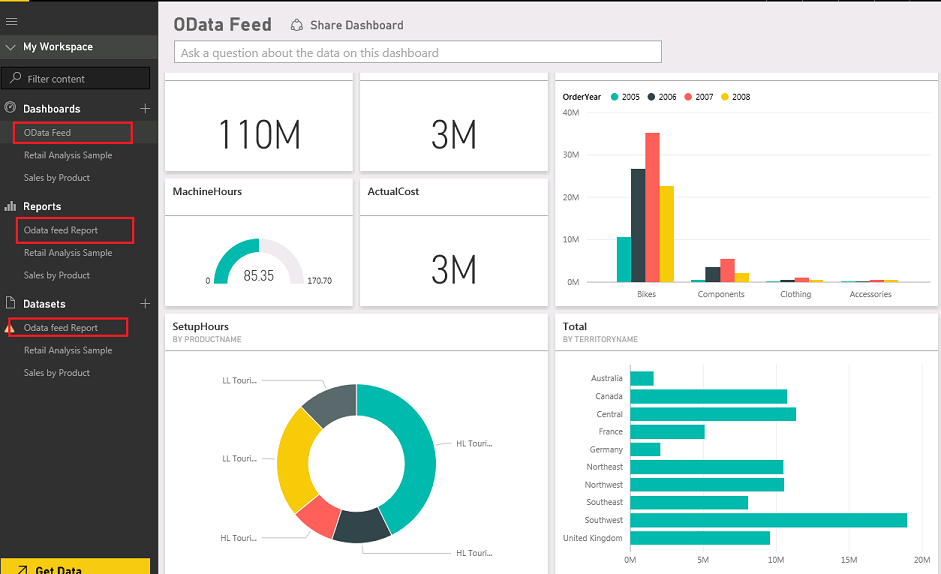
In the same way, I have pinned all report sections in the dashboard section as shown below:
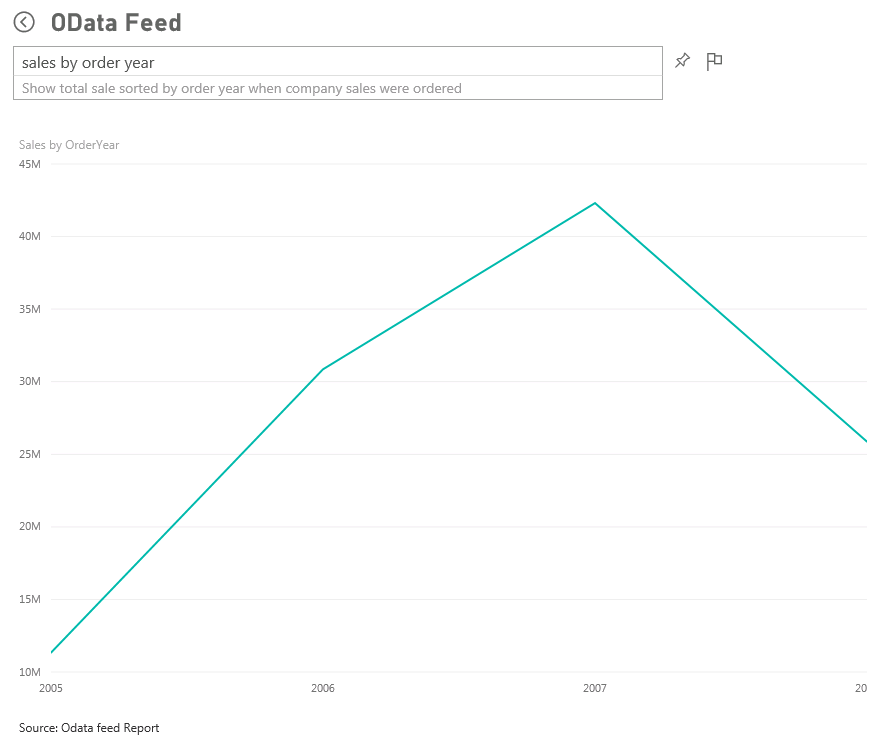
Example screenshot of Q&A in the dashboard:
Conclusion
Microsoft's BI strategy is paving the way for the business users to visualize their data in a great way! We can say Power BI is a Self Service BI platform where you can create reports / dashboards with minimum knowledge on the Microsoft tools.
See Also
Power View Report in SharePoint
Create Power BI report and publish in SharePoint