Azure: KUDU Console
Introduction
This article will help you to understand what the KUDU console is on Microsoft Azure and how to work with KUDU console on Azure.
KUDU Console?
KUDU Console is a debugging service on the Azure platform which allows you to explore your Web App. You can surf the bugs available on it through deployment logs, see memory dumps, upload files towards your Web App, add JSON endpoints to your Web Apps, etc.,
To access the KUDU console of a Web App on Azure, you should be the administrator for that particular Web App. Using your Azure login credentials, you can access the KUDU console of your Web App by entering https://#####.scm.azurewebsites.net
Note: #### is the name of your Web App.
Developer Requirements
- Microsoft Azure account (Click here to get a temporary Azure account free of cost)
- Visual Studio 2015 – optional (If you don’t have a Web App hosted on your account)
- Web Browser
Click here to learn about how to host a Web App using Visual Studio
Follow the steps below to access the KUDU Console of your Web App.
Note:
- In this demo, we will be working with a sample Web App.
- #### refers to the Web App name.
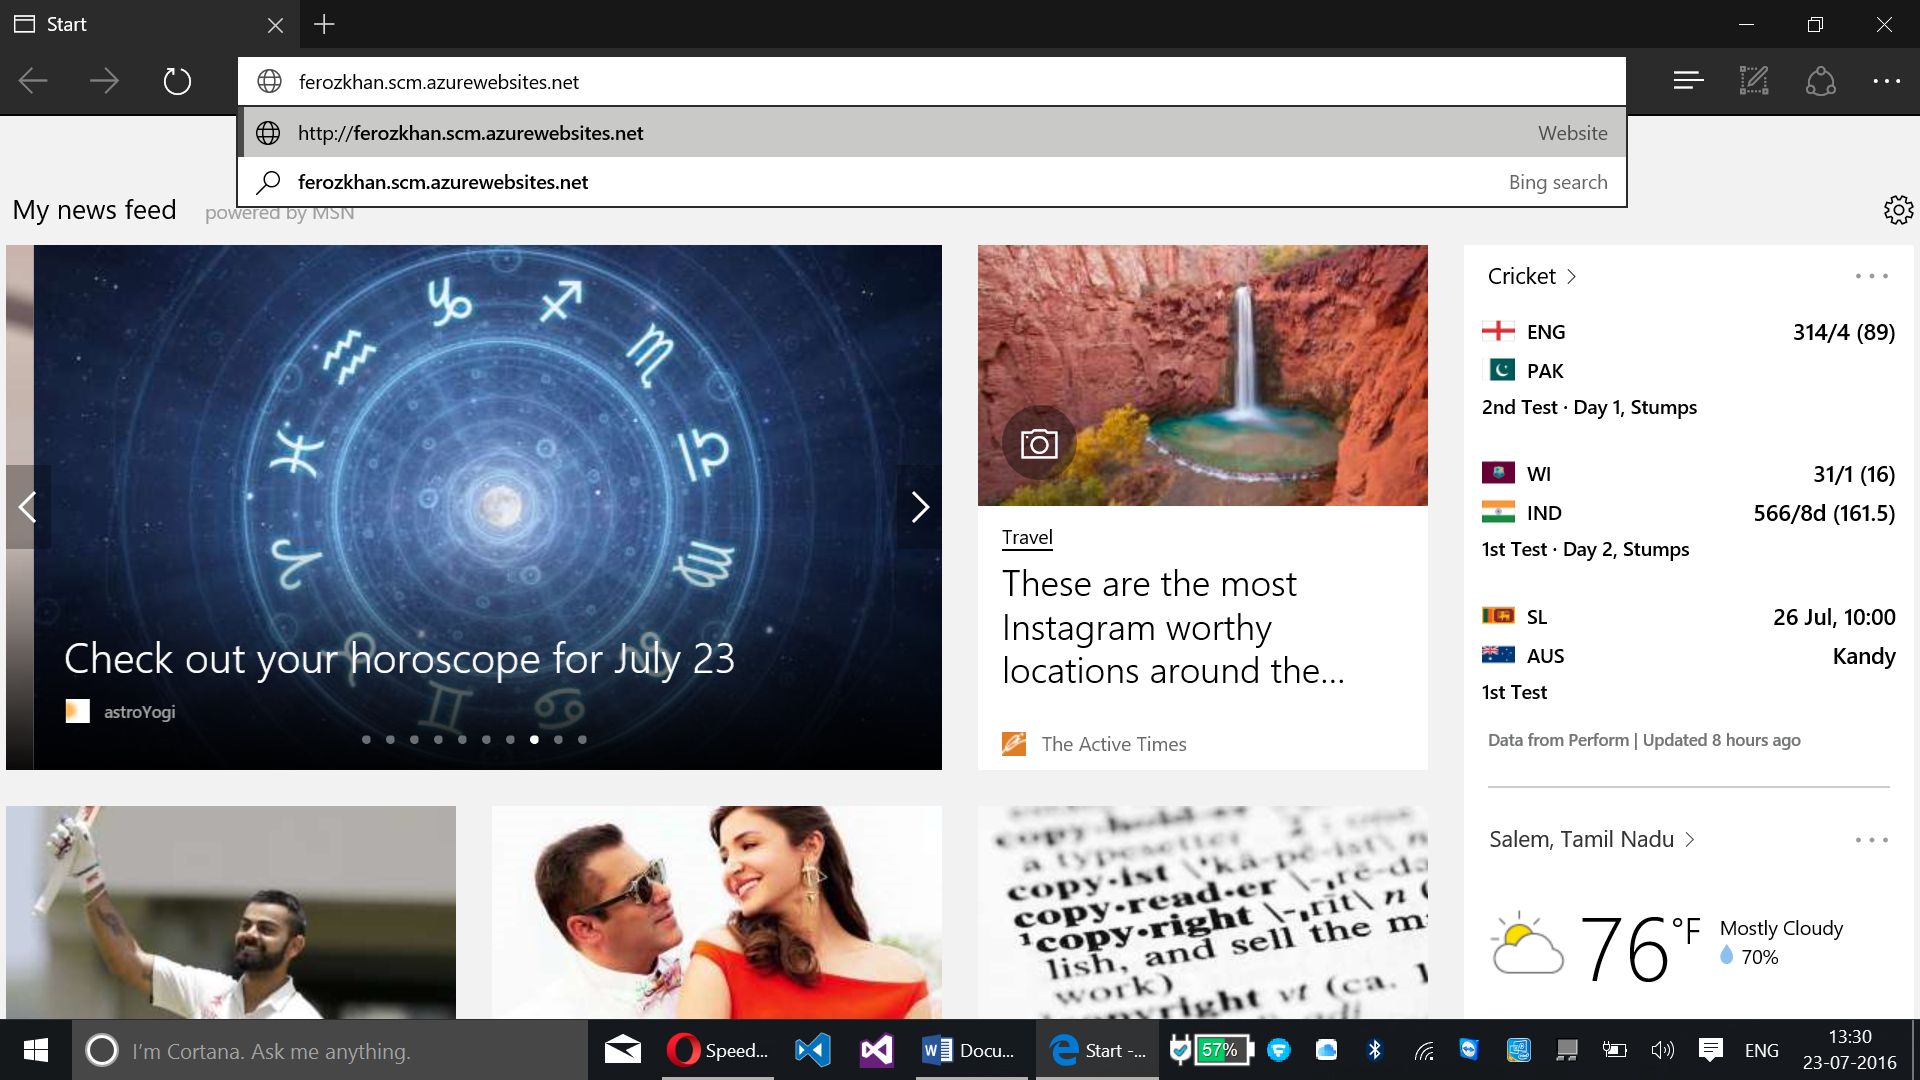
Step – 01:
Open your web browser to https://www.####.scm.azurewebsites.net.
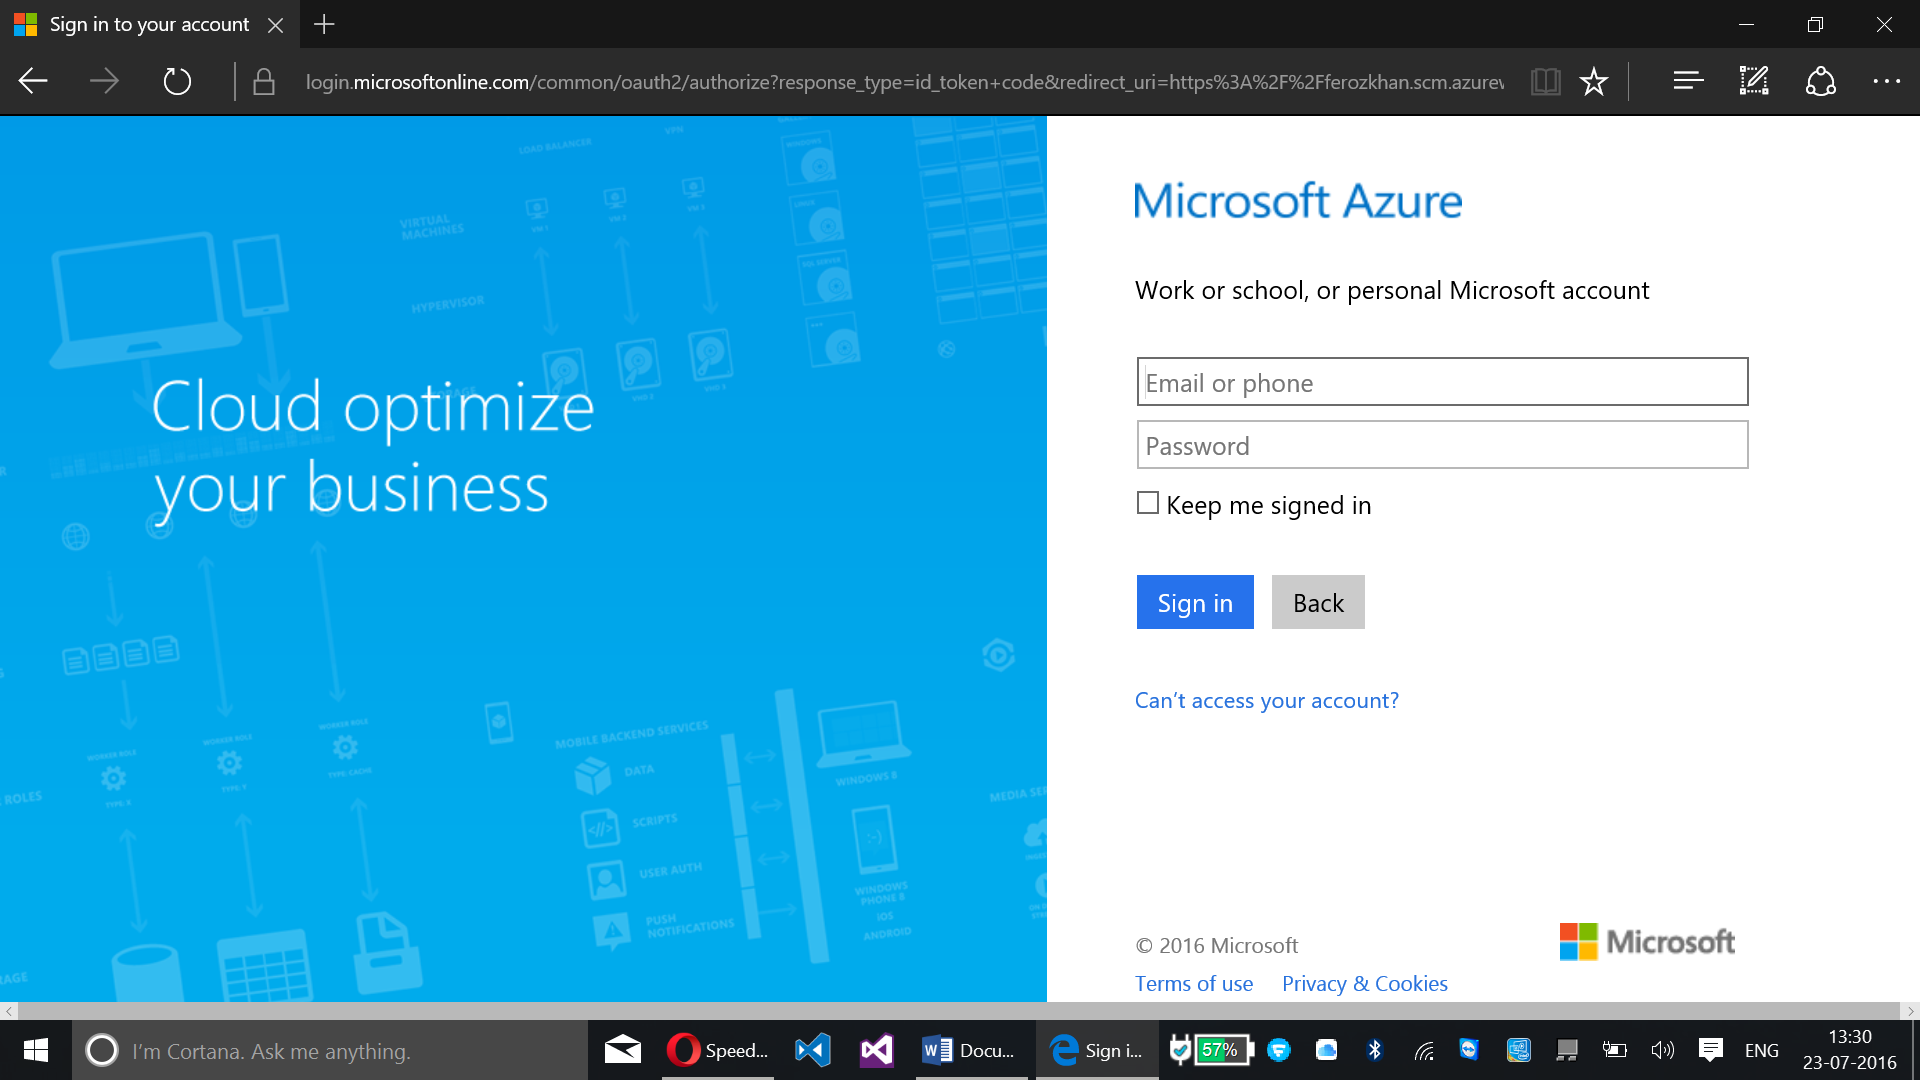
Step - 02:
Enter your Azure login credentials. (Login to the Azure account where your web app is hosted.)
This will take you to the KUDU Troubleshooting Console page of your web app.
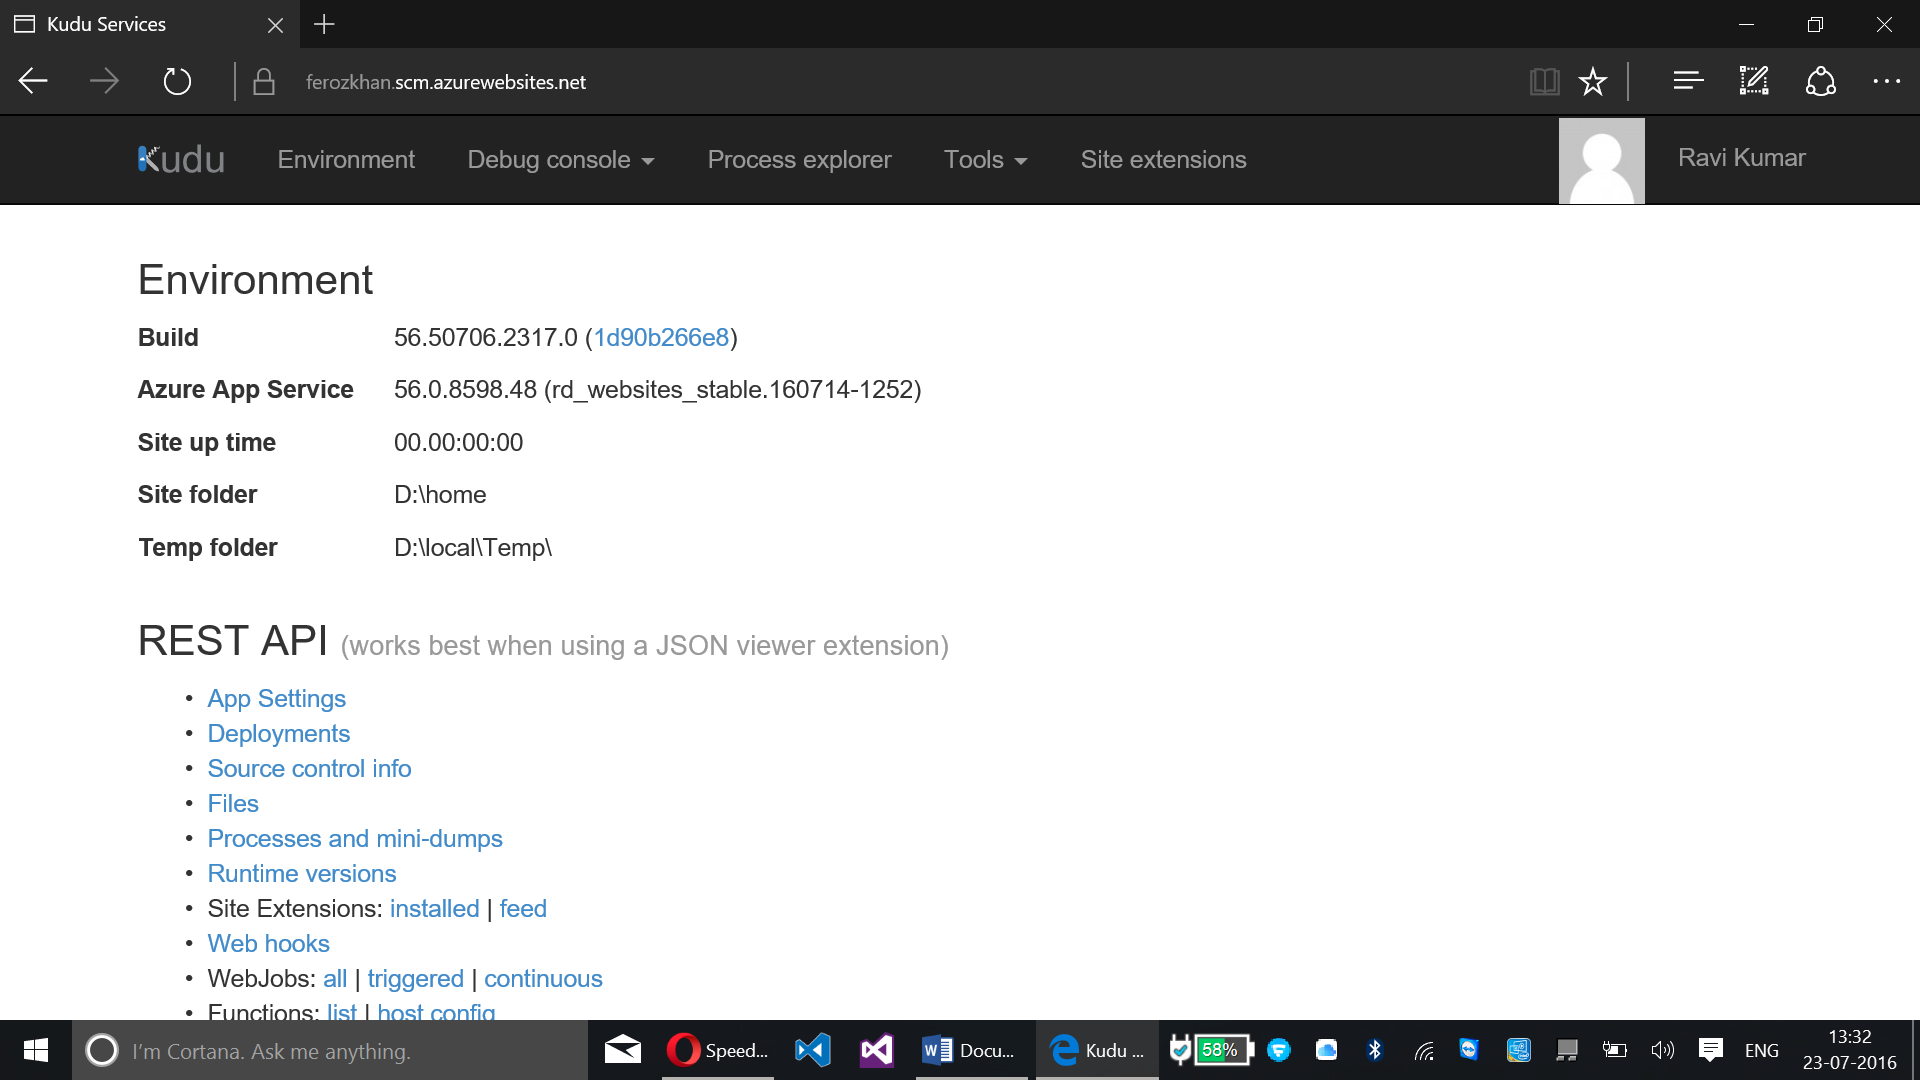
Click Debug console > PowerShell. The page below with PowerShell appears.
Step – 04:
Enter the command powershell –command get-process
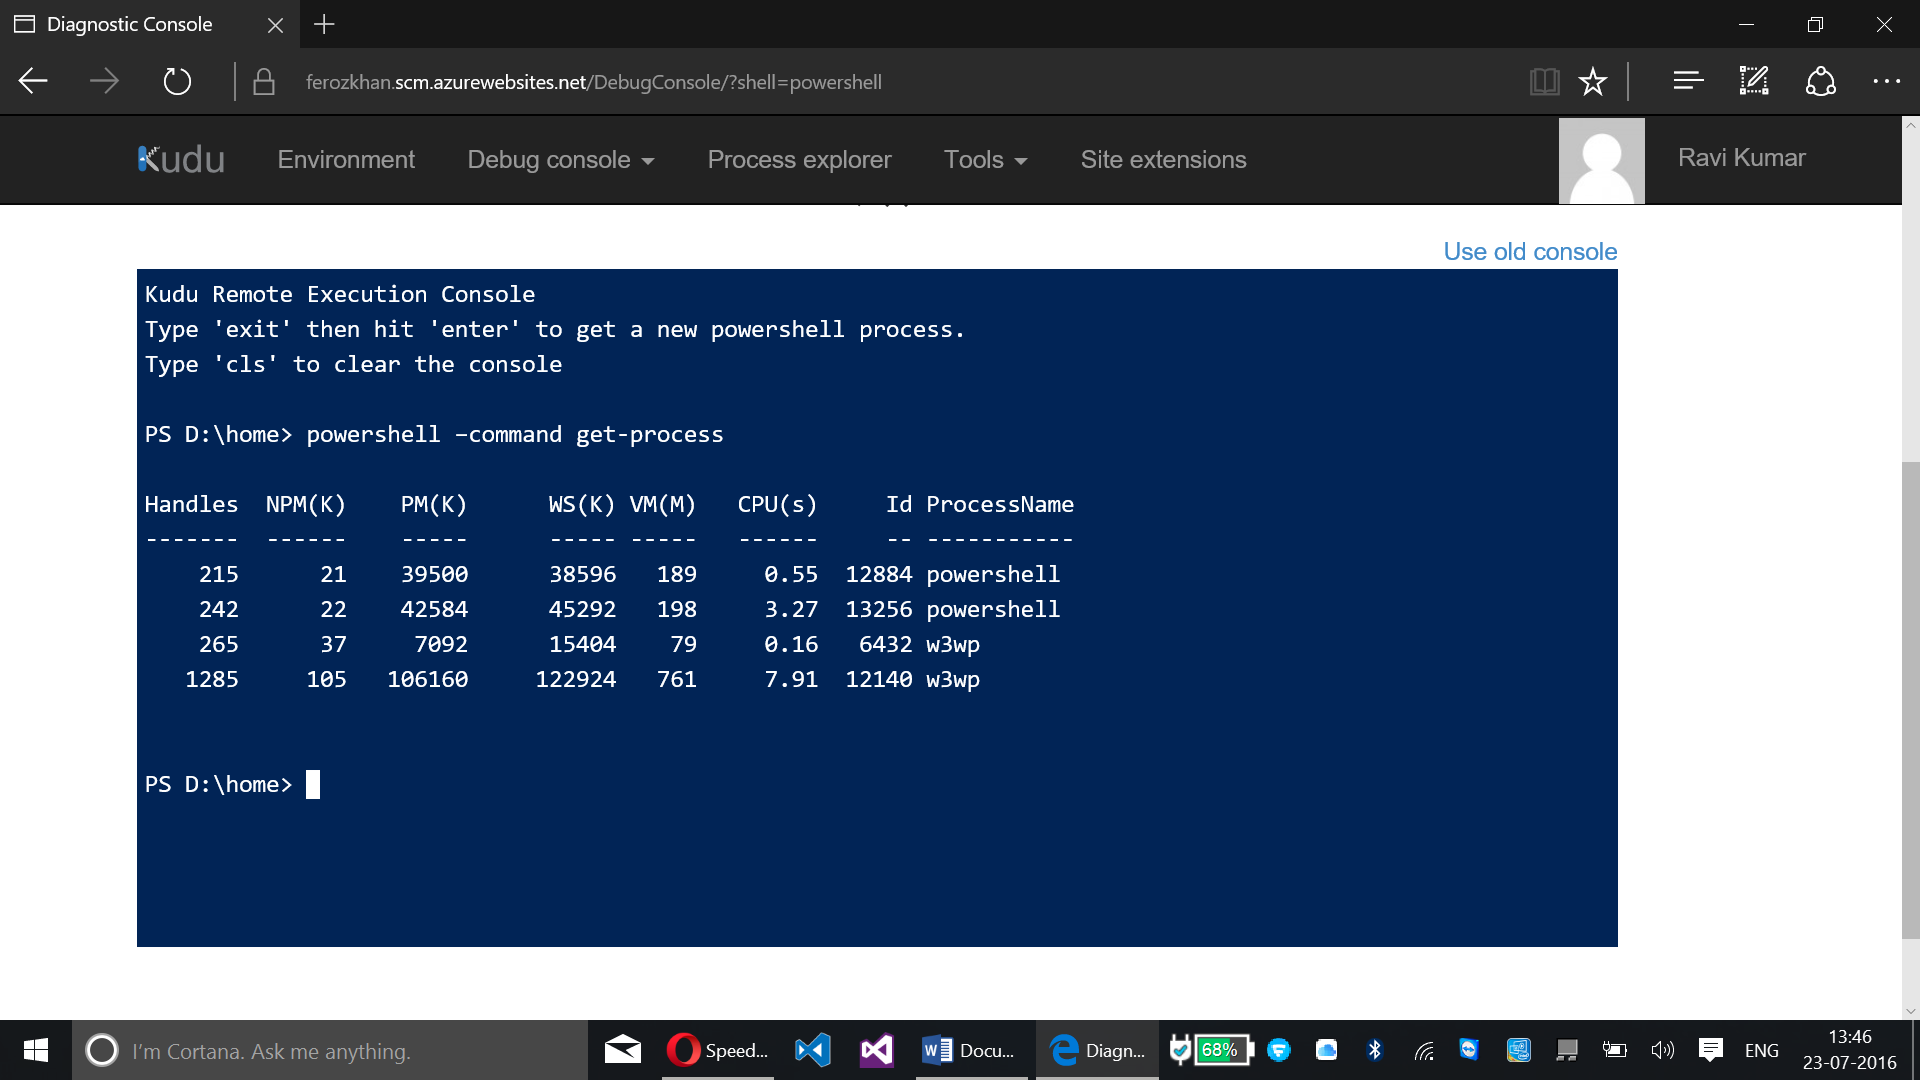
Here you can see the process running on your website.
You can see the changes when you give a request at your website using Id-PID of the W3WP process.
If the changes happen, then the website has crashed or needs to be troubleshooted as to why it happened.