AIMS BizTalk Performance Monitoring - How to evaluate
Introduction
AIMS is an Application Performance Monitoring solution that simplifies your integration monitoring and reporting. On-premises, hybrid or cloud. De-clutter and untangle the complexity of integrations and connected systems to facilitate for informed decisions, priorities and improved operations reporting and monitoring.
AIMS features automated monitoring of all parameters on all BizTalk artifacts - out of the box - without any alert or threshold configuration. Real-time transaction tracing and latency monitoring down to individual ports and orchestrations & end-2-end through the complete value-chain.
Some unique features to mention:
- Automated monitoring using Machine Learning
- Anomaly detection on performance down to individual ports and orchestrations
- Topology - automated documentation of all your messaging patterns with detailed performance statistics
- Analytics - automate reporting and create custom dashboards for any server, host, process or component
To evaluate AIMS and its features we have written this short article to guide you through some intitial setup steps. There are some basics to consider to get the most out of an AIMS trial which we will highlight here, with a focus on the unique features mentioned above. AIMS is available for free trial
Trial suggestions
As mentioned, AIMS has a strong focus on performance monitoring, anomaly and impact detection plus auto-mapping of messaging patterns. To be able to view and properly test all these features we recommend to install AIMS to an environment with the following properties:
- Traffic. Either mirroring of a production environment or at least an environment with contineous traffic for 1-2 weeks. Traffic can of course be generated by custom applications created for testing purposes.
- At least 2-3 applications containing multiple messaging patterns with different complexity
- Tracking does not have to be enabled. AIMS delivers always-on features without the need for tracking or similar functionality.
The AIMS BizTalk agent is designed to be installed to any high throughput / low latency environment. The agent has been successfully tested in Microsoft test facilities with up 500 messages per second without any noticeable performance impact.
Evaluating AIMS features
Anomaly detection
Immediately after installing the AIMS BizTalk agent you can login to AIMS and start using the Topology and Analytics. Since AIMS uses machine learning to set dynamic thresholds based on the unique behavior of your BizTalk environment, the Anomaly detection will not be enabled before after 2 weeks. After a few days you can however start viewing the baselines for every performance parameter directly on the Topology. This is the main reason for having traffic on your trial environment.

Topology
To access the Topology, click the "Topology" tab on the top bar. You will then be presented with the "Overview" section of the Topology. Since AIMS also supports other technologies besides BizTalk, this is the place to see what technologies you are currently monitoring with AIMS and how they are interacting. The BizTalk monitoring is split into to sections on the Topology; Server and BizTalk. The server section contains performance data from the server like CPU, memory, disk etc.

The BizTalk section will show detailed information about the BizTalk applications server; hosts, messaging patterns, ports, orchestrations, message type statistics and more. To view the messaging patterns traced and mapped by AIMS in real-time, select the "Messaging pattern" section. Here you can also rename the patterns to something more meaningful like "Invoices, Orders, Logistics" etc. AIMS will use the new name to report on errors, anomalies, statistics and more. To get more details about each individual component (port & orchestration) you can click them and you will be presented with more information and performance statistics for each individual component.

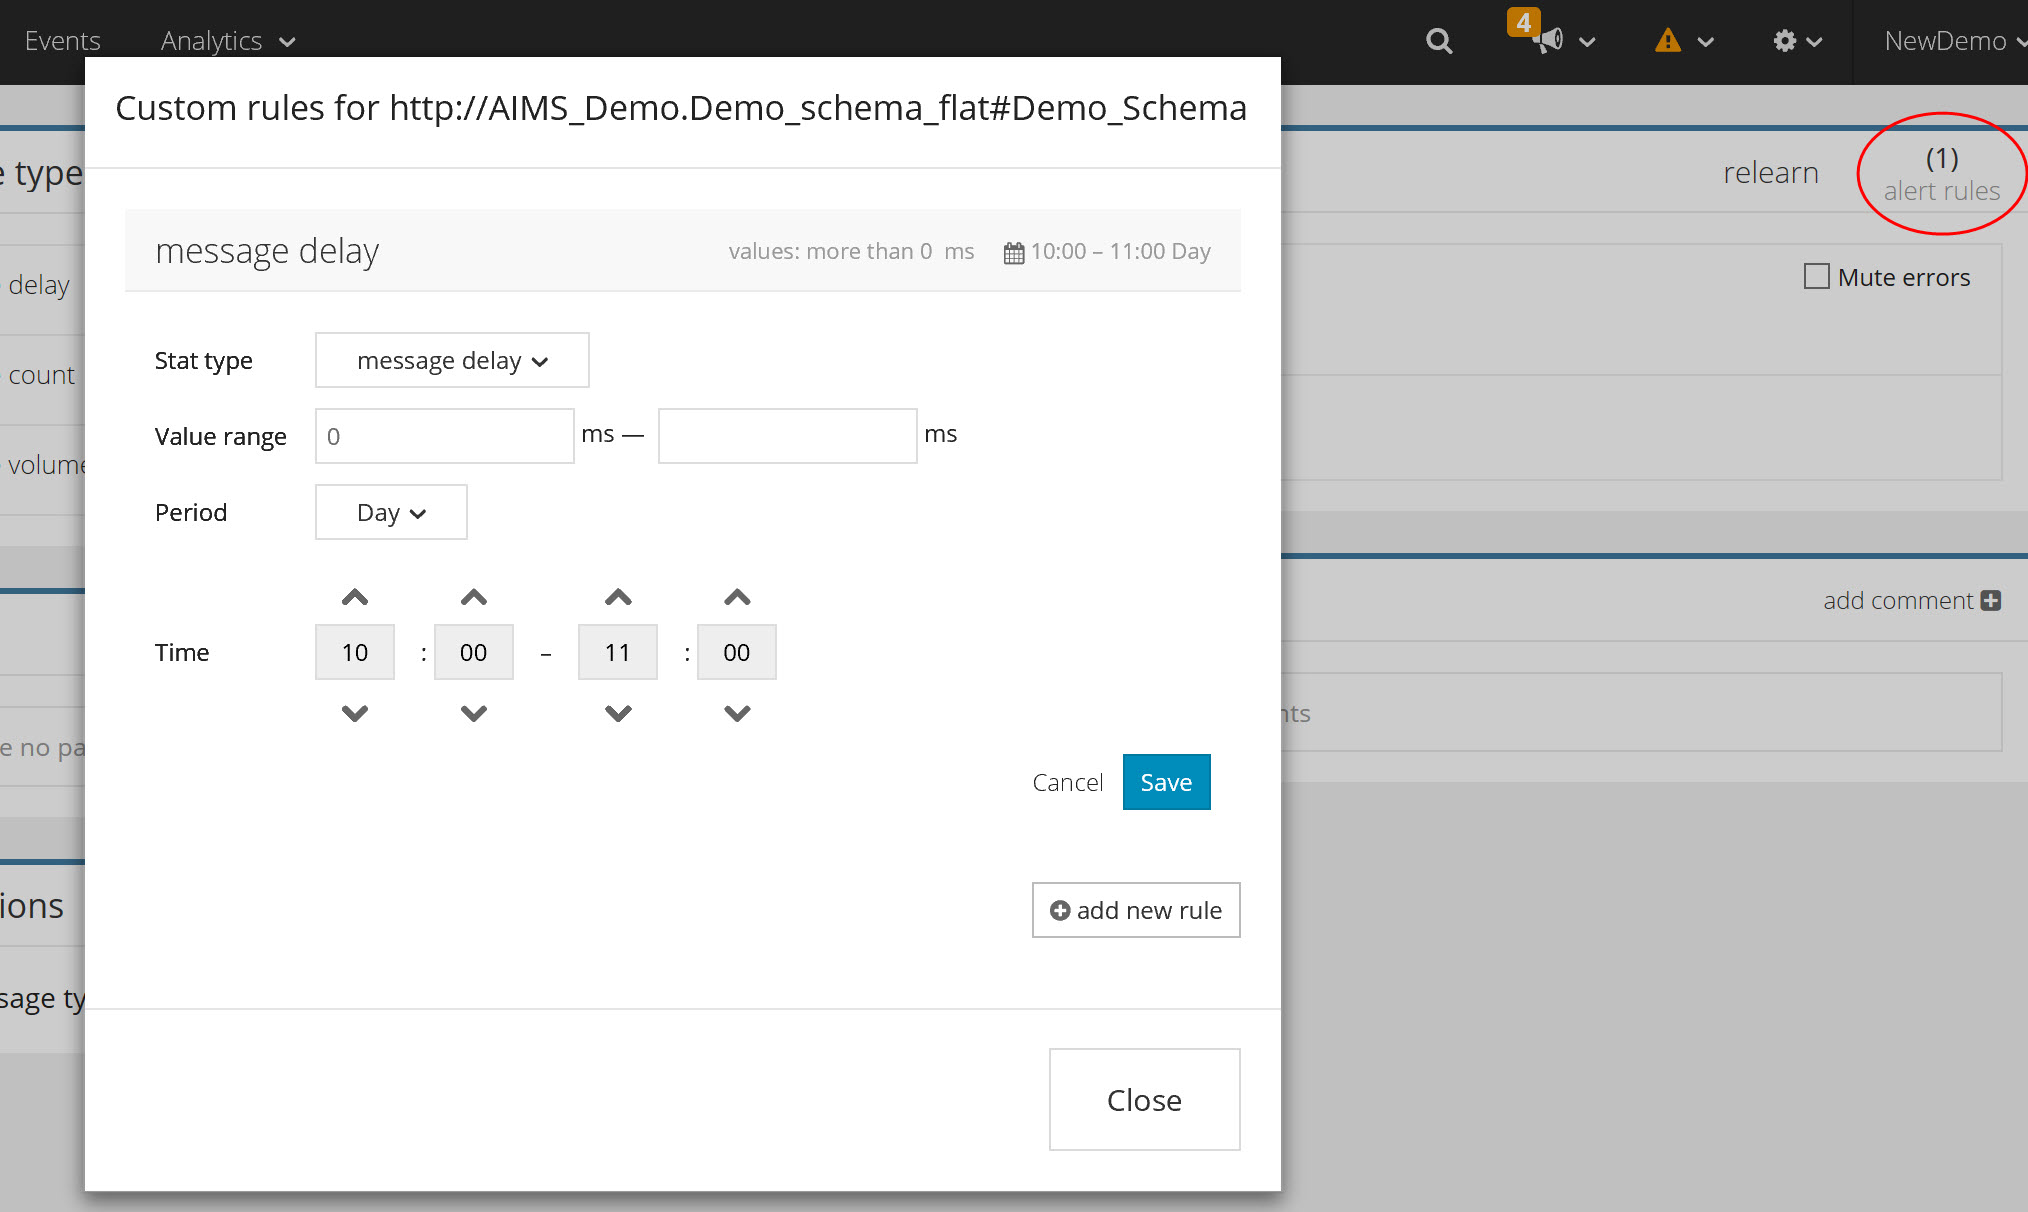
For every component or section on the Topology, you can also add your own custom alerting based on thresholds. Simply click the "Alert Rules" and select the parameter and threshold value.
Analytics
If you want to build custom dashboards, live reports or automated email reports you can access the "Analytics" tab. All parameters that are shown in Topology are also available for charting in the Analytics section.
The most frequently used Analytics component is the charting module. To add a chart, click the "+add block" and then select "Chart". The chart configuration will be presented to the user. First you name the chart "Server Metrics" before moving over to selecting time ranges.

For your trial charts we recommend you leave the default configuration as it will show the past 7 days rolling. You can of course choose if you want to have data presented by day or by hour.
In this example we will focus on how to create a performance overview report of your BizTalk environment.
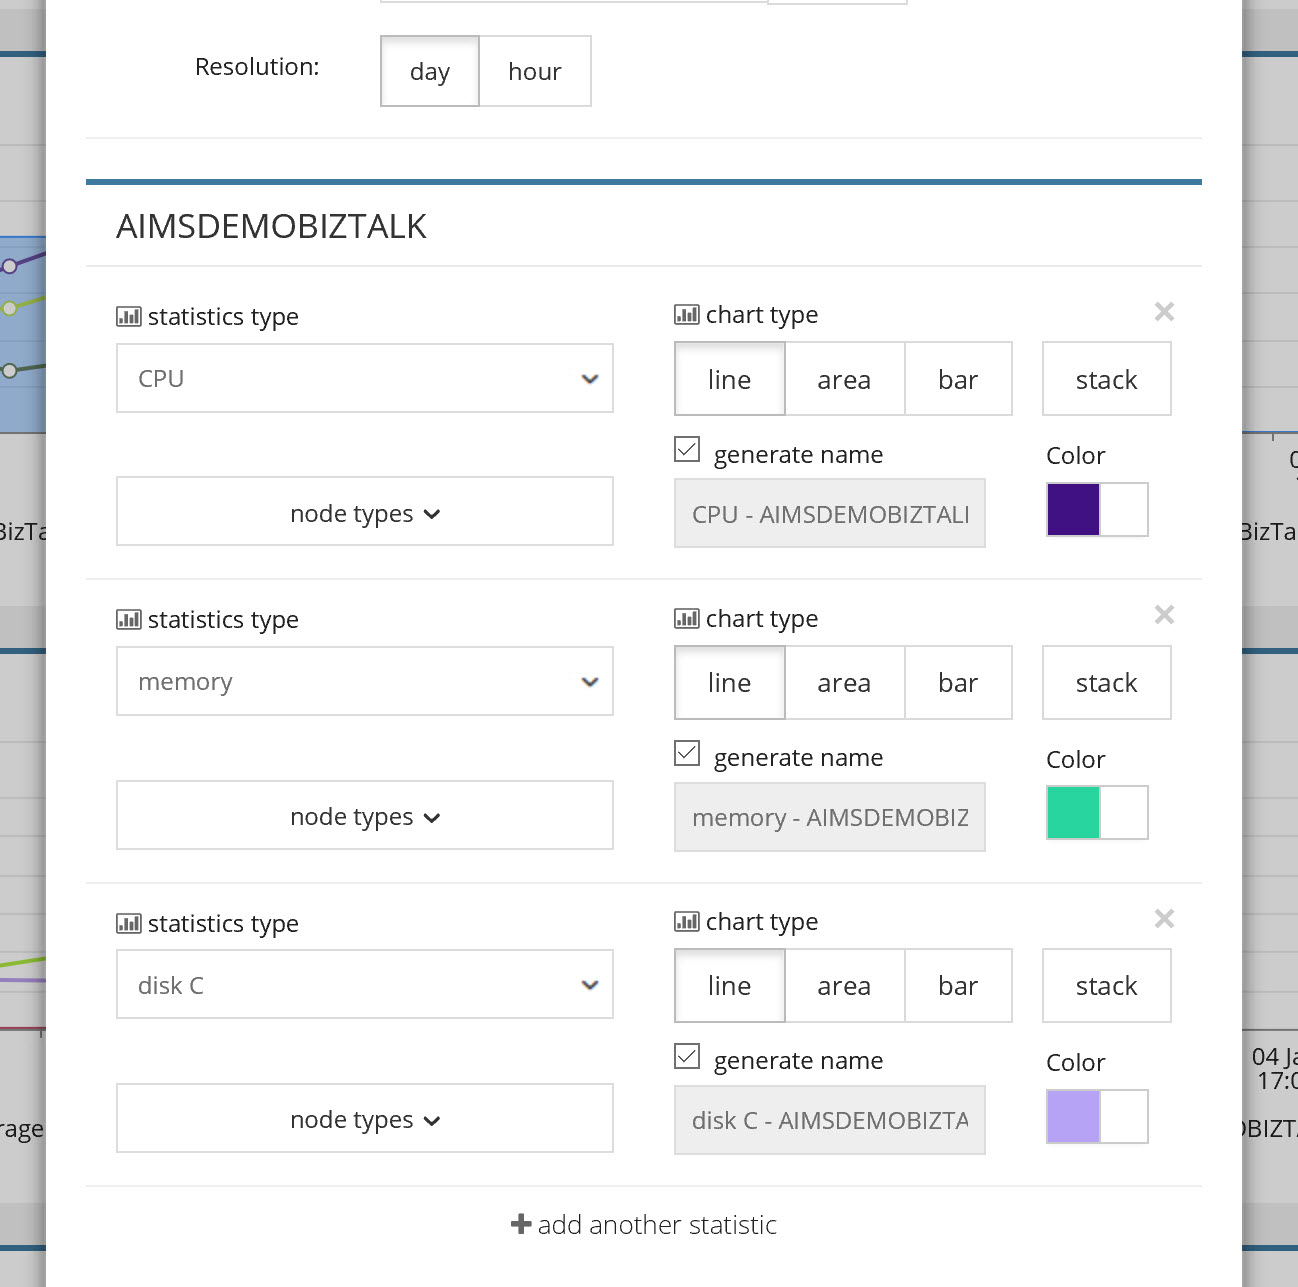
Lets start by adding some server metrics:
- choose "select system" and choose your server (typically your server name)
- statistic types will now be available, choose "CPU"
- click "+add another statistics" to select "Memory"
- click "+add another statistics" to select "Disk C"
Now we got some basic server performance metrics in place, lets add a second chart by again clicking "+add block" and selecting "Chart". Name the chart "BizTalk Metrics" and once again leave the default configuration as is.
We will now add some BizTalk metrics:
- choose "select system" and choose your BizTalk group (typically presented as "BizTalk Group")
- statistic types will now be available, choose "Quantity/message count" - select Node Types -> receive port
- click "+add another statistics" to select "Milliseconds/message delay"
- click "+add another statistics" to select "Bytes/message volume" - select Node Types -> receive port
- click "+add another statistics" to select "Quantity/throttling"

The BizTalk chart just added shows the total number of messages processed (inbound), average latency, total size of processed messages (inbound) and the number of hosts throttling.
You can keep adding more charts with more information as shown above. You can also choose individual components like ports and orchestrations, hosts and messaging patterns by typing the name of the component in the text box, and then select the parameter you want to chart.

Summary
This article only highlights a few of the AIMS monitoring and reporting capabilities. You can get more information about our BizTalk agent here, and also view other monitoring capabilities and plugins here. There is also a collection of recorded webinars on YouTube covering different aspects of AIMS.
See Also
Another important place to find a huge amount of Azure BizTalk Services related articles is the TechNet Wiki itself. The best entry point is BizTalk Server Resources on the TechNet Wiki.