Master Data Services Capacity Guidelines 2016
This document provides capacity planning guidelines and performance data for Microsoft SQL Server 2016 Master Data Services (MDS).
MDS Architecture Overview
**
Master Data Services has a three-tiered architecture consisting of the database, service, and architecture layers, as shown in the following diagram.
**

MDS has two deployment configurations:
- Single-box (SQL Server + IIS on the same computer).
- Two-box (SQL Server on one computer, IIS on the second computer).
Most of the computational work for MDS is done in the database layer, so in most cases in order to increase capacity, a stronger SQL Server computer is required.
Capacity Considerations
Assumptions
Master Data Services was designed to work with data that is relatively slowly changing. Data that is involved in a high volume of transactions (that in some cases are stored in fact tables) should not be stored in MDS.
From a performance perspective, MDS can handle 58.5K distinct changes per day per model on the model with 7 million members without close to the limit (on the hardware described later in this paper). A distinct change involves a separate call (either to entity-based staging or the Windows Communication Foundation API). If significant changes are required, it is recommended that you perform them in batches either through entity-based staging or the WCF APIs. Both methods are tuned for batch operations and will perform much better than making each change separately.
If you need to perform much more than 58.5K calls per day per model or the model with much more members, then it is recommended that you perform a proof of concept on the computer hardware you plan to use.
Significant Impact
The following factors will have a larger impact on MDS performance:
- Entity structure
- Number of members in the larger entities.
- Number of attributes.
- Number of domain-based attributes.
- Number of versions Note: Each version generates a copy of all the data in the entity, but all versions are still stored in the same table.
- Number of business rules.
- Number of concurrent users
- Using row-level security.
Note: There is more information on row-level security in the “Impact of Row-Level Security on Performance” section later in this document.
Smaller Impact
The following factors will have a smaller impact on MDS performance:
- Number of entities and number of models.
- Using role-based and attribute-level security.
Impact of Row-Level Security on Performance
The Microsoft Master Data Services engineering team cautions against adding row-level security to large data sets, because these permissions will generate significant permission data and will limit scalability. The effects of hierarchy-member security on performance can be isolated by comparing performance of the model administrator to the secured users.
The following are tips for securing MDS using hierarchy-member security:
- Always secure MDS using Active Directory groups or local groups. This will facilitate managing role changes. In such cases, changing a user’s group memberships is sufficient, rather than having to change permissions explicitly assigned to the user in MDS.
- Secure MDS using implicit denies as much as possible. Set permissions only for those areas that a user has access to.
- For more information about securing MDS, see Security (Master Data Services).
Performance Tests
Hardware
The performance tests were run on Azure GS3 Virtual Machines (8 cores, 112 GB memory, 1 TB premium storage), in the one-box configuration with the web service and database server sharing the same VM. The performance of this hardware configuration can be used as a reference point for determining your own hardware requirements.
Data
Each set of test data uses one of two models:
- Customer model. Basic model that contains 7 entities. The main entity contains 18 attributes, including 12 Free form attributes plus 6 domain-based attributes that reference the other 6 entities.
- “Wide” model. “Wide” model that contains 26 entities. The main entity contains 100 attributes, including 75 Free form attributes plus 25 domain-based attributes that reference the other 25 entities.
These models are used in the following test data sets :
Data set label |
Model |
Versions |
Members in main entity |
Uses Security? |
C1M_NoSec |
Customer |
2 |
1 million |
No |
C1M_Sec |
Customer |
2 |
1 million |
Yes |
C7M_NoSec |
Customer |
2 |
7 million |
No |
C50M_NoSec |
Customer |
1 |
50 million |
No |
C50M_Sec |
Customer |
1 |
50 million |
Yes |
W1M_NoSec |
Wide |
2 |
1 million |
No |
Method and Reporting
For the data sets that don’t use security, the tests are run as a super-user. When security is used, 10 users and 10 groups are added to MDS, and both object security and member (row-level) security permissions are assigned to each. The tests are run as one of these low-privilege users, for measuring how performance is impacted by the presence of security permission restrictions.
A series of tests are run against each data set. The master data tests emulate the performance of operations (loading, refreshing, creating, updating, and deleting) on thousands of members using the MDS Excel add-in. Each set of tests is repeated ten times. The results are reported two ways:
- A table showing best execution time of the ten runs
- Box-whisker graphs showing performance distribution
The tables show each operation at its best. The charts show operation consistency.
The smaller data sets (less than 50M members) are also tested against the previous version, MDS 2014, as a baseline. The last table column compares these two MDS versions by dividing the MDS 2014 baseline time by the MDS 2016 time, shown as a percentage. Higher percentages signify greater improvement over the baseline version. For ease of analysis, these percentages are color-coded, as follows:
Percentage |
Color |
Description |
<75% |
Red |
Significantly slower than the baseline |
75%-99% |
Yellow |
Somewhat slower |
100%-200% |
Light green |
Same or faster, but less than twice as fast |
>200% |
Dark Green |
More than twice as fast |
Results
MDS 2016 can support a large number of active users doing a combination of master data and management operations with reasonable performance.
**C1M_NoSec and C1M_Sec (1 million members, Customer model, 2 versions)
**
| C1M_NoSec and C1M_Sec | MDS 2014 SP1 | MDS2016 CU1 | ||||
| Tests | Super User | Restricted User | Super User | Restricted User | ||
| Time | Time | Time | Versus 2014 | Time | Versus 2014 | |
| MetadataGetDetail, model Customer, entity: all | 0:00:00.54 | 0:00:00.70 | 0:00:00.20 | 267% | 0:00:00.23 | 308% |
| MetadataGetDetail, model Customer, entity: Customer | 0:00:00.17 | 0:00:00.21 | 0:00:00.10 | 168% | 0:00:00.11 | 194% |
| MetadataGetIdentifiers, model Customer, entity: all | 0:00:00.03 | 0:00:00.03 | 0:00:00.01 | 520% | 0:00:00.01 | 386% |
| MetadataGetIdentifiers, model Customer, entity: Customer | 0:00:00.03 | 0:00:00.03 | 0:00:00.01 | 275% | 0:00:00.01 | 275% |
| Load 1k | 0:00:01.42 | 0:00:03.06 | 0:00:00.56 | 254% | 0:00:00.69 | 441% |
| Load 10k | 0:00:02.68 | 0:00:05.25 | 0:00:01.46 | 184% | 0:00:01.58 | 332% |
| Load 50k | 0:00:10.60 | 0:00:27.16 | 0:00:06.07 | 175% | 0:00:06.43 | 422% |
| Load All (1M) | 0:03:48.53 | 0:08:32.04 | 0:02:06.82 | 180% | 0:02:13.05 | 385% |
| Refresh 1k | 0:00:01.56 | 0:00:03.05 | 0:00:00.54 | 288% | 0:00:00.68 | 450% |
| Refresh 10k | 0:00:02.40 | 0:00:05.18 | 0:00:01.42 | 169% | 0:00:01.43 | 363% |
| Refresh 50k | 0:00:10.50 | 0:00:26.77 | 0:00:05.61 | 187% | 0:00:06.02 | 445% |
| Refresh All (1M) | 0:03:59.32 | 0:08:07.03 | 0:01:59.23 | 201% | 0:02:07.32 | 383% |
| Create 1k | 0:00:04.93 | 0:00:08.31 | 0:00:03.49 | 141% | 0:00:03.32 | 250% |
| Create 10k | 0:00:36.81 | 0:00:49.62 | 0:00:21.55 | 171% | 0:00:22.95 | 216% |
| Create 50k | 0:03:40.76 | 0:04:22.20 | 0:01:51.57 | 198% | 0:01:58.27 | 222% |
| Update 1k | 0:00:05.00 | 0:00:26.28 | 0:00:03.90 | 128% | 0:00:04.18 | 629% |
| Update 10k | 0:00:43.60 | 0:01:28.50 | 0:00:31.84 | 137% | 0:00:32.26 | 274% |
| Update 50k | 0:03:23.29 | 0:06:48.92 | 0:02:41.27 | 126% | 0:02:47.31 | 244% |
| Create Entity with 7 Attributes | 0:00:03.33 | - | 0:00:01.04 | 321% | - | - |
| Create Entity with 20 Attributes | 0:00:04.54 | - | 0:00:00.69 | 658% | - | - |
| Create Entity with 200 Attributes | 0:00:49.17 | - | 0:00:01.93 | 2545% | - | - |
| Delete 1k | 0:00:01.86 | 0:00:03.35 | 0:00:00.31 | 607% | 0:00:00.31 | 1078% |
| Change attribute 1k | 0:00:04.89 | - | 0:00:04.65 | 105% | - | - |
** **
Restricted User Performance Penalty. Measures how much performance is degraded by applying security permission restrictions to a user. For the tested data set, MDS 2016 has a much lower penalty when compared with the same results from MDS 2014 SP1. It is almost negligible.
Tests |
MDS2014 SP1 |
MDS2016 CU1 |
MetadataGetDetail, model Customer, entity: all |
77% |
89% |
MetadataGetDetail, model Customer, entity: Customer |
79% |
91% |
MetadataGetIdentifiers, model Customer, entity: all |
96% |
71% |
MetadataGetIdentifiers, model Customer, entity: Customer |
100% |
100% |
Load 1k/indexed |
50% |
97% |
Load 10k/indexed |
50% |
92% |
Load 1k |
46% |
81% |
Load 10k |
51% |
92% |
Load 50k |
39% |
94% |
Load All (1M) |
45% |
95% |
Refresh 1k/indexed |
46% |
82% |
Refresh 10k/indexed |
47% |
91% |
Refresh 1k |
51% |
80% |
Refresh 10k |
46% |
100% |
Refresh 50k |
39% |
93% |
Refresh All (1M) |
49% |
94% |
Create 1k |
59% |
105% |
Create 10k |
74% |
94% |
Create 50k |
84% |
94% |
Update 1k |
19% |
93% |
Update 10k |
49% |
99% |
Update 50k |
50% |
96% |
Delete 1k |
55% |
98% |
C7M_NoSec (7 million members, Customer model, 2 versions)
MDS2014 SP1 |
MDS2016 CU1 |
||
Tests |
Time |
Time |
Versus MDS2014 |
MetadataGetDetail, model Customer, entity: all |
0:00:00.529 |
0:00:00.094 |
563% |
MetadataGetDetail, model Customer, entity: Customer |
0:00:00.186 |
0:00:00.047 |
396% |
MetadataGetIdentifiers, model Customer, entity: all |
0:00:00.028 |
0:00:00.005 |
560% |
MetadataGetIdentifiers, model Customer, entity: Customer |
0:00:00.033 |
0:00:00.008 |
413% |
Load 1k/indexed |
0:00:01.573 |
0:00:00.703 |
224% |
Load 10k/indexed |
0:00:04.178 |
0:00:01.387 |
301% |
Load 1k |
0:00:01.256 |
0:00:00.474 |
265% |
Load 10k |
0:00:04.154 |
0:00:01.364 |
305% |
Load 50k |
0:00:12.728 |
0:00:06.462 |
197% |
Load All (1M) |
0:03:58.763 |
0:02:17.907 |
173% |
Refresh 1k/indexed |
0:00:01.215 |
0:00:00.401 |
303% |
Refresh 10k/indexed |
0:00:03.980 |
0:00:01.135 |
351% |
Refresh 1k |
0:00:01.436 |
0:00:00.398 |
361% |
Refresh 10k |
0:00:03.921 |
0:00:01.154 |
340% |
Refresh 50k |
0:00:12.588 |
0:00:05.991 |
210% |
Refresh All (1M) |
0:04:08.169 |
0:02:24.460 |
172% |
Create 1k |
0:00:05.260 |
0:00:03.532 |
149% |
Create 10k |
0:00:38.214 |
0:00:23.585 |
162% |
Create 50k |
0:03:09.810 |
0:01:54.988 |
165% |
Update 1k |
0:00:04.833 |
0:00:04.013 |
120% |
Update 10k |
0:00:41.767 |
0:00:32.090 |
130% |
Update 50k |
0:03:23.152 |
0:02:47.080 |
122% |
Create Entity with 7 Attr |
0:00:03.203 |
0:00:01.367 |
234% |
Create Entity with 20 Attr |
0:00:04.579 |
0:00:00.750 |
611% |
Create Entity with 200 Attr |
0:00:50.436 |
0:00:02.005 |
2516% |
Delete 1k |
0:00:02.945 |
0:00:00.338 |
871% |
Change Attribute with 1K members |
0:00:04.637 |
0:00:04.212 |
110% |
C50M_NoSec and C50M_Sec (50 million members, Customer model, 2 versions)
There is no MDS2014 baseline for this data set due to MDS2014’s lesser capacity.
MDS2016 |
MDS 2016 |
|
Tests |
Time |
Time |
MetadataGetDetail, model Customer, entity: all |
0:00:00.190 |
0:00:00.23 |
MetadataGetDetail, model Customer, entity: Customer |
0:00:00.084 |
0:00:00.11 |
MetadataGetIdentifiers, model Customer, entity: all |
0:00:00.004 |
0:00:00.01 |
MetadataGetIdentifiers, model Customer, entity: Customer |
0:00:00.011 |
0:00:00.01 |
Load 1k |
0:00:00.607 |
0:00:00.71 |
Load 10k |
0:00:01.422 |
0:00:01.54 |
Load 50k |
0:00:06.386 |
0:00:06.93 |
Refresh 1k |
0:00:00.541 |
0:00:00.69 |
Refresh 10k |
0:00:01.452 |
0:00:01.76 |
Refresh 50k |
0:00:05.890 |
0:00:06.34 |
Create 1k |
0:00:03.233 |
0:00:03.57 |
Create 10k |
0:00:20.210 |
0:00:24.01 |
Create 50k |
0:01:50.716 |
0:02:07.06 |
Update 1k |
0:00:03.993 |
0:00:04.59 |
Update 10k |
0:00:30.785 |
0:00:36.13 |
Update 50k |
0:02:39.198 |
0:03:09.89 |
Create Entity with 7 Attributes |
0:00:00.932 |
N/A |
Create Entity with 20 Attributes |
0:00:00.641 |
N/A |
Create Entity with 200 Attributes |
0:00:03.354 |
N/A |
Delete 1k |
0:00:00.710 |
0:00:00.33 |
Change attribute 1k |
0:00:04.543 |
N/A |
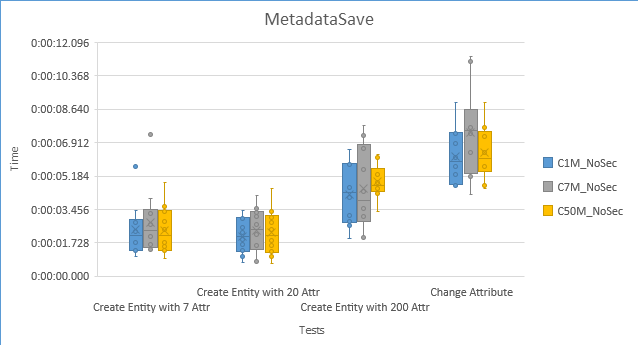
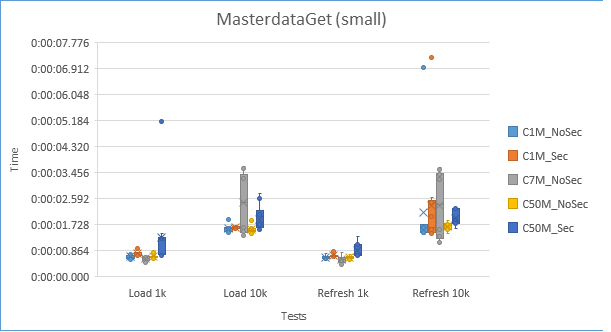
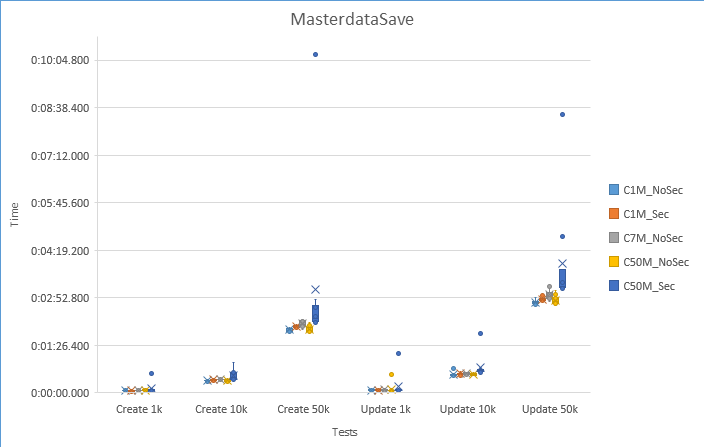
Box-whisker graphs for data sets that use the Customer model, MDS2016 results only. We can see that having a larger number of members (50M) slightly degrades the performance of large master data save operations (save/update 50K members), but has little impact on all other tested operations.


W1M_NoSec (1 million members, Wide model, 2 versions)
| MDS2014 SP1 | MDS 2016 CU1 | ||
| Tests | Time | Time | Versus MDS2014 |
| MetadataGetDetail, model Wide100Attributes25DBA, entity: all | 0:00:02.542 | 0:00:00.135 | 1883% |
| MetadataGetDetail, model Wide100Attributes25DBA, entity: WideEntity | 0:00:00.469 | 0:00:00.072 | 651% |
| MetadataGetIdentifiers, model Wide100Attributes25DBA, entity: all | 0:00:00.028 | 0:00:00.005 | 560% |
| MetadataGetIdentifiers, model Wide100Attributes25DBA, entity: WideEntity | 0:00:00.034 | 0:00:00.008 | 425% |
| Load 1k/indexed | 0:00:06.921 | 0:00:01.867 | 371% |
| Load 10k/indexed | 0:00:25.156 | 0:00:07.544 | 333% |
| Load 50k/indexed | 0:01:41.340 | 0:00:31.975 | 317% |
| Refresh 1k/indexed | 0:00:06.260 | 0:00:01.607 | 390% |
| Refresh 10k/indexed | 0:00:24.964 | 0:00:06.891 | 362% |
| Refresh 50k/indexed | 0:01:44.466 | 0:00:30.460 | 343% |
| Create 1k | 0:00:31.967 | 0:00:24.448 | 131% |
| Create 10k | 0:04:15.693 | 0:03:17.259 | 130% |
| Create 50k | 0:21:27.982 | 0:16:50.904 | 127% |
| Create Entity with 7 Attributes | 0:00:03.398 | 0:00:01.551 | 219% |
| Create Entity with 20 Attributes | 0:00:04.880 | 0:00:01.388 | 352% |
| Create Entity with 200 Attributes | 0:00:50.966 | 0:00:02.928 | 1741% |
| Delete 1k | 0:00:02.826 | 0:00:00.349 | 810% |
| Change Attribute with 1K members | 0:00:15.954 | 0:00:04.699 | 340% |
Model Deployment:
Microsoft SQL Server 2016 introduced major performance improvement to model deployment to creating and deploying large amount of data.
C1M_NoSec (1 million members, Customer model, 2 versions)
|
MDS2014 SP1 |
MDS 2016 CU1 |
|
Tests |
Time |
Time |
Versus MDS2014 |
Create Package |
00:17:34 |
00:03:36 |
488% |
Deploy-Update |
00:11:24 |
00:43:36 |
164% |
Deploy-Clone |
01:11:17 |
00:36:34 |
195% |
W1M_NoSec (1 million members, Wide model, 2 versions)
Note: This model could not be deployed in MDS 2014 using this hardware.
|
MDS2014 SP1 |
MDS 2016 CU1 |
|
Tests |
Time |
Time |
Versus MDS2014 |
Create Package |
1:10:06 |
00:12:29 |
562% |
Deploy-Update |
NA |
9:03:59 |
|
Deploy-Clone |
NA |
6:09:02 |
|
C7M_NoSec (7 million members, Customer model, 1 version)
Note: No baseline numbers for 7 million members as MDS 2014 SP1 couldn’t create package for model with 7 million members.
|
MDS 2016 CU1 |
Tests |
Time |
Create Package |
00:33:09 |
Deploy-Update |
05:42:00 |
Deploy-Clone |
06:26:13 |
Load Test
We also run load test to identify how the MDS system behaves under different workloads. This helps us to determine the maximum capacity that MDS system can support and the bottlenecks.
Hardware
Like all previous tests in this article, we use Azure GS3 VM and one box configuration.
Data
All Load tests are using Customer Model mentioned in the earlier section, and we use the following data sets in different test runs.
Data set label |
Model |
Versions |
Members in main entity |
Uses Security? |
C7M_NoSec |
Customer |
2 |
7 million |
No |
C50M_NoSec |
Customer |
1 |
50 million |
No |
Method and Load Patterns
We set up four different kinds of users to run different test scenarios:
- Web UI admin user
- Web UI regular User
- Excel AddIn Admin user
- Excel AddIn regular user
For each user type, there will be multiple users running in parallel, and each user run different test scenarios multiple times as defined in the following table. For example, this test has 20 excel AddIn regular users; each excel regular user will run 12 Load 100K member scenarios (aka, kick off one such scenario every 5 minutes), 20 **create 1k entity member **scenarios, 20 delete 1k entity member scenarios, 20 refresh 1k row scenario, and 20 update 1k member scenarios.
Each load test will be run for 48 hours to eliminate randomness. Without specific clarification, all tests are using the same static configuration.
User |
User Count |
Scenario |
Operation count Per Hour Per User |
Excel Addin Admin |
4 |
Create an entity with 1K rows from excel worksheet |
12 |
Excel Addin User |
20 |
Load an entity with 100K rows into excel worksheet |
12 |
|
|
Create an entity with 1k row from excel worksheet |
20 |
|
|
Delete 1k selected members from an entity in excel worksheet |
20 |
|
|
Refresh 1k selected rows from excel worksheet |
20 |
|
|
Update 1k members from excel worksheet |
20 |
Web UI Admin |
4 |
Load MDS web home page |
12 |
|
|
Load MDS “Manage Model” web page |
12 |
|
|
Load MDS “Manage Business Rule” web page |
12 |
|
|
Load MDS “Manage Entity” web page |
12 |
|
|
Load MDS “Mange Attribute” web page |
12 |
Web UI User |
20 |
Load MDS web home page |
12 |
|
|
Load MDS “Explore” web page |
12 |
|
|
Create 1 entity member via web UI |
20 |
|
|
Delete 1 entity member via web UI |
20 |
|
|
Update 1 entity member via web UI |
20 |
|
|
Load Next page in web UI |
20 |
Results
First, let’s compare the load test run result between C7M_NoSec and C50M_NoSec data set:
|
C7M_NoSec |
C50M_NoSec |
||||
|
Max |
|
Average |
Max |
|
Average |
Tests/Sec |
2.60 |
|
1.16 |
2.27 |
|
1.16 |
Avg. Test Time |
25.4 sec |
|
1.31 sec |
20.7 sec |
|
1.86 sec |
CPU usage |
99% |
|
30.8% |
100% |
|
46.5% |
Memory usage |
57.9% |
|
38.8% |
67% |
|
46.4% |
Disk I/O usage |
42.8% |
|
14% |
51.4% |
|
14.7% |
C7M_NoSec: the MDS server handles this data set pretty well. The Disk IO and memory usage are well below the 70% thresholds. There are only very few times that CPU usage reaches to 90%, but on average it consumes 30.8% CPU.
C50M_NoSec: the MDS server can handle this data set, but it is at the boundary mainly due to CPU limitation. The memory increases, but not reach to the 70% threshold. The DISK IO usage does not increase much. The CPU usage increases significantly in this workload and frequently hits the 90% threshold. Most of CPU usage increase contributes to SQL Server, and there is only a little change on IIS CPU usage. However, the system still responded to all test requests and finished all the test scenarios in 48 hours.
Second, we also modify the test configuration by gradually increasing the user count to determine the maximum number of users that MDS system can handle.
This test uses C7M_NoSec as data set, and starts with the following set of users:
- 4 Web UI admin users
- 5 Web UI regular users
- 4 Excel AddIn Admin Users
- 5 Excel AddIn regular Users
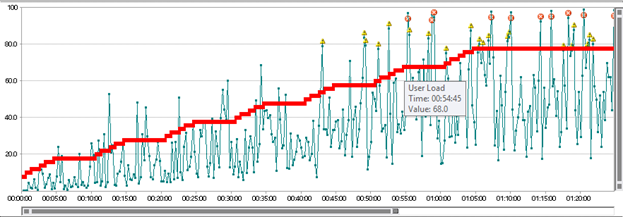
The test scenarios are the same as before for each user. Every 15 minutes, we add 5 users Excel AddIn regular Users and 5 Web UI regular users.
The result is shown in the below graph. Around total 68 users, the system hit the 90% CPU usage threshold frequently, and the system is at the boundary.
**Load Test Conclusion: **
With the current hardware configuration and the load pattern described before,
- MDS can handle C7M_NoSec data set with 48 users in parallel pretty well.
- MDS can handle C50M_NoSec data set with 48 users in parallel at the boundary.
- MDS can handle C7M_NoSec data set with 68 users in parallel at the boundary.
CPU is the main factor/bottleneck determining the MDS performance, and especially SQL Server CPU consumption determines how MDS system performs in terms of workload.