Microsoft Dynamics CRM 2011 - SSRS Multi-Series Chart and Display in Dashboard
One of the helpful additions to new CRM 2011 features is Dashboards. In dashboards, charts can give us concise view and an accurate idea of the information we are looking for. If we can always get access to the information easily and whenever needed, then getting to a calculated decision becomes easy.
I remember, in one of my previous projects, client wanted me to have a similar dashboard experience. The problem was Microsoft Dynamics CRM version 4.0. Back then dashboards were not out of the box. So I had to write a custom made solution which was a combination of out of the box entities, plugins, silverlight and custom workflow activities. Not anymore. Dashboards are built into CRM 2011 framework.
My blog on CRM 2011 Dashboards will be coming soon!!!
I will demo how to create a multi series column chart in SQL Server Reporting Services (SSRS). I will also show how to add & display this chart on a custom CRM 2011 dashboard.
1) First I will create a multi series SSRS chart in Visual Studio report project. Then I will display this chart in a custom CRM 2011 dashboard.
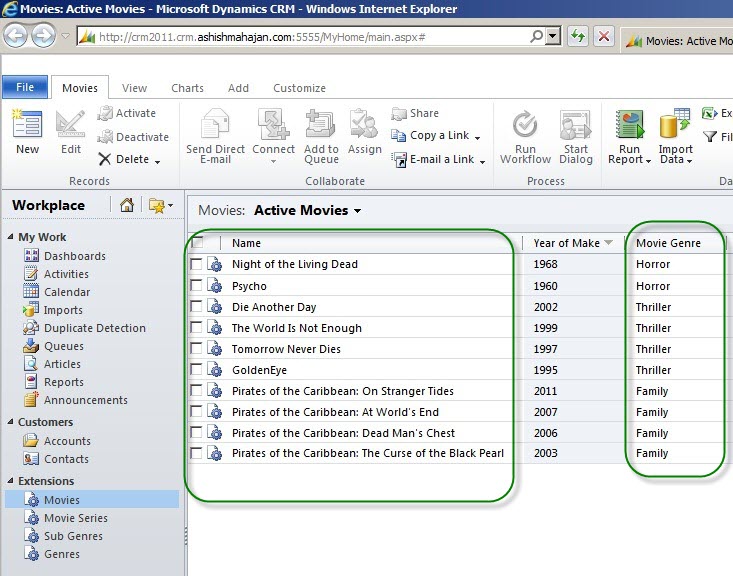
The chart will compare the total cost of production for movies and the revenue for these movies for each genre. This chart will compare cost and revenue for the movie genres of Horror, Thriller and Family.
CRM 2011 when released did not have the capability of multi series charts. This capability or enhancement was added as part of Microsoft Dynamics CRM November 2011 service update. The chart wizard now supports the ability to specify multiple data series when designing charts.
http://4.bp.blogspot.com/-OfDlFZ6D3v0/Tz2gTf3HFxI/AAAAAAAAAEI/3Tu2IdxjeFI/s1600/Movie+List.jpg |
Movie Records (used as data in SSRS Multi Series Column Chart) |
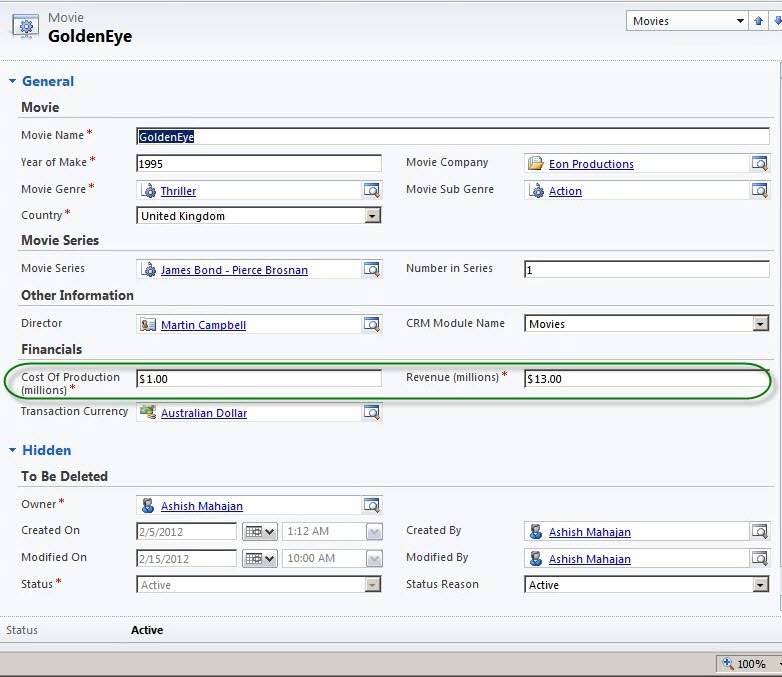
2) I have opened a movie record. This record has 2 fields "Cost of Production" and "Revenue". Both these fields are in millions (let's say currency is AUD - Australian Dollars).
http://3.bp.blogspot.com/-LfmZJKC4fsQ/Tz26m1fMW8I/AAAAAAAAAEg/l-EwLkmiJQQ/s1600/Currency+Fields.jpg |
Fields "Cost of Production" and "Revenue" will be used in Multi Series Column Chart |
3) I will create this multi series chart outside the CRM 2011 environment. I will create this chart as part of a Visual Studio report project or SSRS project or Business Intelligence project. Open Visual Studio 2008.
Note: Even though we use Visual Studio version 2010 for CRM 2011 development, but this version cannot be used for reports development. Microsoft SQL Server 2008 or 2008 R2 installs the report project templates in Visual Studio version 2008 (instead of Visual Studio 2010). Visual Studio 2010 only supports developing local reports (.rdlc).
http://3.bp.blogspot.com/-yqiUHTKwSYc/Tz27aPcW_yI/AAAAAAAAAEo/lUATnWS0ETQ/s640/VisualStudio2008.jpg |
Visual Studio to Create a Report Project |
4) Create a report server project. Name the project "MovieReports". Define the location for the project.
http://3.bp.blogspot.com/-9h0mgeJD6uc/Tz28j6_9vKI/AAAAAAAAAEw/B5da-qRai4I/s1600/CreateProject.jpg |
Create a Report Project |
5) After the report project is created, add a new report. Name this report "CostVsRevenue". The report is an .rdl file. I can use this file in 2 ways. Later I can import this file in Microsoft Dynamics CRM 2011 or I can deploy it to a reporting server. For our demo, I will deploy this report file to SQL Server 2008 R2 Reporting Server and use the URL address for dashboard display.
http://3.bp.blogspot.com/-WATrn1_kCNM/Tz3BOI0hGvI/AAAAAAAAAFI/g4V27z8dZdY/s1600/AddReport.jpg |
Create a New Report |
6) In this new report, add a data source. Data source is a connection string embedded inside the report. This connection string connects the report data to a SQL Server database.
http://2.bp.blogspot.com/-wd_dOAStMiw/Tz3B5CEox5I/AAAAAAAAAFQ/Wlm2T2Y0rGU/s640/AddDataSource.jpg |
Add a Data Source |
7) Click Edit button on the data source window. This will open another window to select a SQL Server and a database.
http://1.bp.blogspot.com/-4wMSAfmSb-I/Tz3QqOAjzqI/AAAAAAAAAFY/Ir0HtzH3MfA/s1600/AddDataSource1.jpg |
Data Source Window |
8) In this window select a SQL Server which hosts your CRM 2011 database. I have selected the default Windows Authentication. Select the MS CRM 2011 database. Click OK button.
http://3.bp.blogspot.com/-X9JKiDVK3Zw/Tz3Y9dVG4II/AAAAAAAAAFg/K-c5VdNQ0JU/s1600/AddDataSource2.jpg |
Create a Data Connection |
9) The connection string is created. I have named my data source "Movies". Click OK button.
http://3.bp.blogspot.com/-BkY2uO2RWbA/Tz3ah80vE6I/AAAAAAAAAFo/5AhtNSQNITU/s1600/AddDataSource3.jpg |
Data Connection String as Data Source |
10) Add a new dataset. Dataset is a TSQL query connecting back to the database and getting results. Dataset will feed the data to our multi series column chart.
http://1.bp.blogspot.com/-4SMY85Q5BcI/Tz3bTRLPj9I/AAAAAAAAAFw/IyrdgnO3plU/s640/Add+DataSet.jpg |
Add a Dataset |
11) I have named my dataset "CostVsRevenueSQL". Now I will create and test my TSQL query in SQL Server R2 Management Studio.
http://1.bp.blogspot.com/-OgYH4uQLV2s/Tz3jox0nS6I/AAAAAAAAAF4/LIG_TwENN80/s1600/Add+DataSet1.jpg |
Define a TSQL Statement |
12) Open the SQL Server R2 Management Studio. Below is the query which I have created and tested. This query returns the SUM of cost and revenue. It is grouped by movie genre.
http://3.bp.blogspot.com/-OwsQ4XdgqCc/Tz3mDTdVD9I/AAAAAAAAAGQ/YkHJ-nr7vYM/s1600/Add+DataSet2.jpg |
Create and Test the TSQL Statement |
13) I will now embed my TSQL statement in the dataset "Query" field. I have selected "Movies" as my data source which I created above (STEP - 7).
http://4.bp.blogspot.com/-_ZmPKu9cDOI/Tz3oyMy1kbI/AAAAAAAAAGY/19eiImPm9Fc/s1600/Add+DataSet3.jpg |
Save the Dataset |
14) The new dataset appears under the Datasets folder.
http://4.bp.blogspot.com/-2EmltIoah2A/T0rf0W09UZI/AAAAAAAAAI4/5mQb8ATBqaU/s1600/Add+DataSet4.jpg |
Dataset Added |
15) I am all set to insert my chart, as I have my data ready. Take your mouse anywhere on the report's design surface and right click your mouse. Select Insert and then select Chart. This will bring the chart window.
http://1.bp.blogspot.com/-_8OoO8XRm5k/T0rgYLpY0PI/AAAAAAAAAJA/aOF5v-oSsyU/s1600/Add+Chart+1.jpg |
Add a Multi Series Column Chart |
16) There are many types of charts like Column, Line, Shape, Bar, Area, Range, Scatter and Polar. I have selected the first Column type chart which can handle a multi series display. My demo also applies to many other types of charts. You can use my demo in the same way with other charts.
http://4.bp.blogspot.com/-A_2k2QYDDU4/T0rgsYSNTYI/AAAAAAAAAJI/uGzFlzWNAko/s1600/Add+Chart+2.jpg |
Select a Chart |
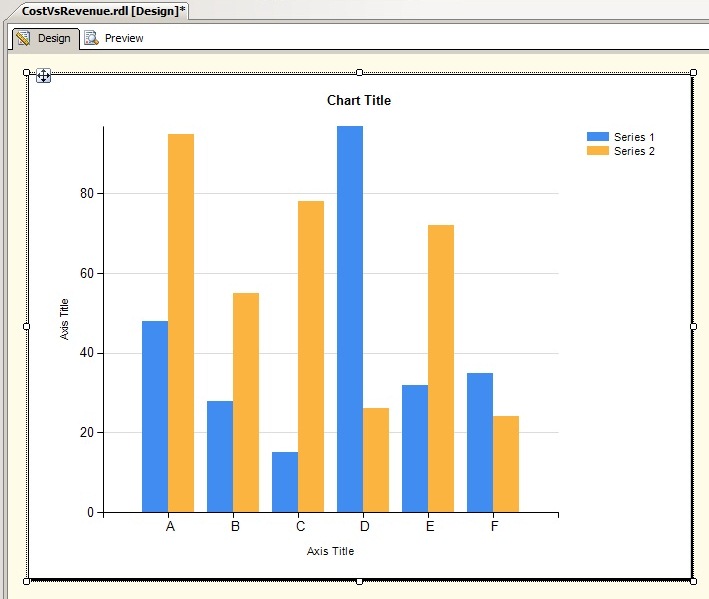
17) This will create a chart skeleton on my report. Now I can start binding data to the chart and I can customize chart as per business requirements.
http://1.bp.blogspot.com/-raF5P5ZNYO4/T0rhffYXjnI/AAAAAAAAAJQ/1-jypmrfTvc/s1600/Add+Chart+3.jpg |
The Multi Series Column Chart Added |
18) Select and click over on the top right hand corner which has "Series 1" and "Series 2" displayed. This will bring the "Chart Data" window. Add values. Do this by clicking the green plus sign at the right corner. This will bring all the fields from the query.
Since we are comparing cost and revenue, I will select options "Cost_of_Production" and "Revenue". This will add these fields as values. Cost and revenue will be part of "Y-Axis" on the column chart.
http://2.bp.blogspot.com/-7FIWfIpOSD8/T0riFu7VQPI/AAAAAAAAAJY/FfD56Zf5_lM/s1600/Configure+Chart+1.jpg |
Add the Numerical Financial Data Values |
19) Now I will add the "Group By" data which will form part of "X-Axis" on the column chart. We are only interested in cost and revenue for movie genres, so we select movie genre.
http://1.bp.blogspot.com/--dkwW4WxuGs/T0ria6IPzhI/AAAAAAAAAJg/JTdO8F3CJNw/s1600/Configure+Chart+2.jpg |
Add the Movie Genre as a Category Group |
20) Our final chart data selected looks like below.
http://4.bp.blogspot.com/-4Q3xChqPQIE/T0rkA9UW9wI/AAAAAAAAAJw/gtdkggI2jW0/s1600/Configure+Chart+3.jpg |
Chart Values and Category Groups |
21) I renamed the title, X-Axis and Y-Axis displays for my chart. I gave more meaningful names for what it represents.
http://3.bp.blogspot.com/-wOheWOtM5BQ/T0roA39xB6I/AAAAAAAAAKI/g4whUzzPNHo/s1600/Configure+Chart+4.jpg |
Add and Modify Chart and Axis Label |
22) I will go to Preview tab and run my report.
The report is running and displaying data as required. It is called as multi series column chart as we have 2 columns side by side displaying 2 different value types.
http://4.bp.blogspot.com/-3_P97AQK-VY/T0ropfojJLI/AAAAAAAAAKQ/_4dwPV9qoA0/s1600/Run+Chart+1.jpg |
Cost Vs Revenue Chart Output for all the Movie Genres |
23) Take your mouse over the project name in Solution Explorer in Visual Studio 2008. Right click the project name and select properties. This will bring the properties window as shown below. I have added the values as per my scenario. These values will be used to deploy my report to the required folder inside reporting server as per what I need.
http://1.bp.blogspot.com/-lfBepWrXi4c/T0rp6zAs_mI/AAAAAAAAAKY/Xnclki46nyc/s1600/Deploy+Chart+1.jpg |
Report Project's Deployment Settings |
24) I will now deploy my report. Select the report and right click and select "Deploy". This will deploy my report on the reporting server. I can access my report through a browser.
http://3.bp.blogspot.com/-lxEM_G5Pzt8/T0rw4pZmizI/AAAAAAAAAKg/YAYEgfcJL2E/s1600/Deploy+Chart+2.jpg |
Deploy the Chart |
25) Open Internet Explorer. I will go to my reports area and which is "http://crm2011/reportserver". Then as per the project settings I had given above (STEP-23), I can see my report under the folder structure "/MyHome_MSCRM/CustomReports/MovieReports".
http://3.bp.blogspot.com/-F4i3einVWng/T0rxgxwSZtI/AAAAAAAAAKo/m9DvJKKnv7Y/s640/Deploy+Chart+3.jpg |
Test the Chart from the Reports Server in a Browser (Internet Explorer) |
26) Click the report to run in Internet Explorer. The report runs fine. Copy the URL address of this report which is required to display report in the CRM 2011 Dashboard IFrame.
http://4.bp.blogspot.com/-KNadCZCOa2Q/T0rzFbABN0I/AAAAAAAAAKw/HNiaDbhoHHE/s1600/Deploy+Chart+4.jpg |
Run the Chart and Get the URL Address |
27) I will open CRM 2011 in the browser (Internet Explorer). I will go to my unmanaged solution where I need this new dashboard added. I will go to Dashboards section and click on New.
http://1.bp.blogspot.com/-DmBX4fep9zs/T0rzmq9Z3iI/AAAAAAAAAK4/BW--oIjMLtg/s1600/Dashboard.jpg |
Create a new Dashboard in Movies (Unmanaged Solution) |
28) This brings "Select Dashboard Layout" window. I will select the dashboard of type "3-Column Focused Dashboard". This is helpful in case our dashboard component display is large in height and width.
In my case I would like to display the chart in a bigger cell.
http://4.bp.blogspot.com/-uvawGJBi66o/T0r0Af_uMGI/AAAAAAAAALA/XXMAxOxxPdI/s1600/Dashboard+1.jpg |
Add a 3-Column Focused Dashboard |
29) Selecting the type will open the new dashboard in edit mode. I will add my SSRS chart to the first cell. The best option is to add an IFrame to the first cell and then display the chart in this IFrame. Click on "Select Iframe" option.
http://3.bp.blogspot.com/-8cu39x-0yF4/T0r5UyPjYxI/AAAAAAAAALI/urPHog6cua8/s1600/Dashboard+2.jpg |
In First Column Insert an IFrame |
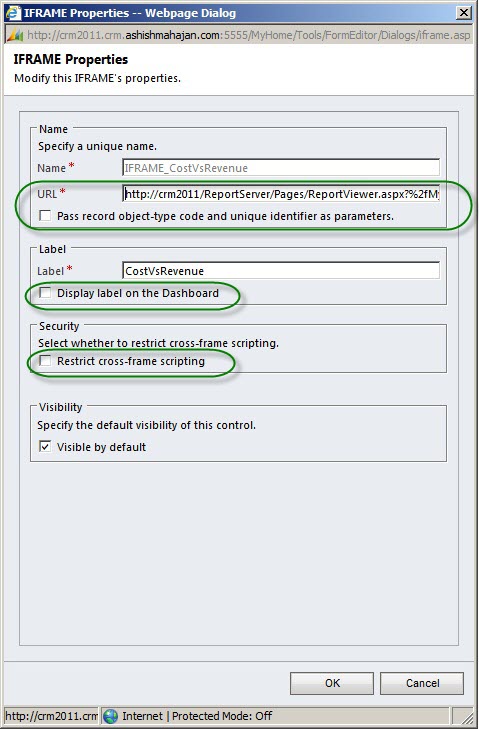
30) The IFrame window opens. I have named my IFrame as "CostVsRevenue". The URL address which I had copied in STEP-26, I will paste it in IFrame URL.
Pay special attention to 3 check boxes. I haven't selected "Pass record object-type code and unique identifier as parameters" check box. I have not selected "Display label on the Dashboard" check box. I have also not selected "Restrict cross-frame scripting" check box.
http://1.bp.blogspot.com/-x_e5k3XVLK8/T0xBROCJ7xI/AAAAAAAAAMY/2_7a3O9yXBU/s1600/Dashboard+3.jpg |
Define IFrame Properties |
31) The IFrame "CostVsRevenue" gets created. I have named my dashboard "Movies". I will "Save and Close" my dashboard.
http://1.bp.blogspot.com/-UtiohzKydIA/T0r7ldPNckI/AAAAAAAAALo/LfdgtTl-jL4/s1600/Dashboard+4.jpg |
Save and Close the Dashboard |
32) I will publish my changes by clicking "Publish All Customizations". This will make my dashboard available. This dashboard will be visible through the CRM "Dashboards" navigation in the "Workplace" area.
http://3.bp.blogspot.com/-NKp38zeo39g/T0r_Ip0tGyI/AAAAAAAAALw/OiRwS9XF8sQ/s1600/Dashboard+5.jpg |
Publish the Dashboard |
33) I will go to "Dashboards" (left hand side navigation) under Workplace.
http://3.bp.blogspot.com/-51zXdLRRcHY/T0sDkDvJ6uI/AAAAAAAAAL4/qRkDRDOKTR0/s1600/Dashboard+6.jpg |
CRM Dashboard Section |
34) I will go to "Dashboard" (right hand side) select list. I will select my newly created dashboard "Movies".
http://4.bp.blogspot.com/-e7CUg6Bg-Hs/T0sHqZERuII/AAAAAAAAAMA/gQrVpJsFQk8/s1600/Dashboard+7.jpg |
Select "Movies" Dashboard |
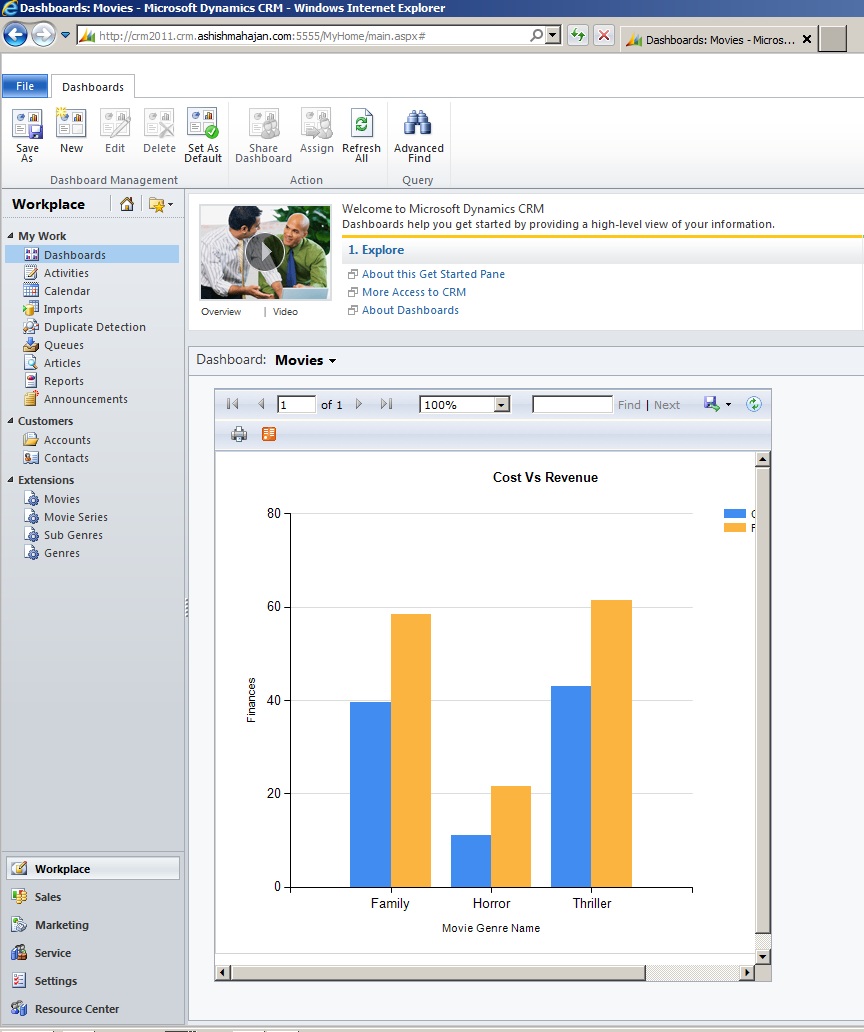
35) Here it is, my multi series column chart displayed beautifully in the dashboard.
http://3.bp.blogspot.com/-VlutQNDCOKk/T0sIF1Yd1_I/AAAAAAAAAMI/e9Y6AeEr9s8/s640/Dashboard+8.jpg |
"Multi Series Column SSRS Chart" Displayed in a Custom CRM 2011 Dashboard |
As we saw above, multi series charts are very helpful and powerful. Microsoft Dynamics CRM 2011 brings to us extensive charting and dashboard capabilities, helping the users to analyse their data quickly and effectively. The chart control is rendered as a single image.
Multi series charts help us compare and analyse 2 different values for the same type.
I hope this blog about 'SSRS Multi-Series Chart and Display in Dashboard' was informative. Please feel free to leave your comments.