Note
Access to this page requires authorization. You can try signing in or changing directories.
Access to this page requires authorization. You can try changing directories.
Note
This isn't the latest version of this article. For the current release, see the .NET 10 version of this article.
Warning
This version of ASP.NET Core is no longer supported. For more information, see the .NET and .NET Core Support Policy. For the current release, see the .NET 10 version of this article.
This article describes how to debug Blazor apps, including debugging Blazor WebAssembly apps with browser developer tools or an integrated development environment (IDE).
Blazor Web Apps can be debugged in Visual Studio or Visual Studio Code.
Blazor WebAssembly apps can be debugged:
- In Visual Studio or Visual Studio Code.
- Using browser developer tools in Chromium-based browsers, including Microsoft Edge, Google Chrome, and Firefox.
Available scenarios for Blazor WebAssembly debugging include:
- Set and remove breakpoints.
- Run the app with debugging support in IDEs.
- Single-step through the code.
- Resume code execution with a keyboard shortcut in IDEs.
- In the Locals window, observe the values of local variables.
- See the call stack, including call chains between JavaScript and .NET.
- Use a symbol server for debugging, configured by Visual Studio preferences.
Unsupported scenarios include:
- Debug in non-local scenarios (for example, Windows Subsystem for Linux (WSL) or Visual Studio Codespaces).
- Debug in Firefox from Visual Studio or Visual Studio Code.
Blazor Server apps can be debugged in Visual Studio or Visual Studio Code.
Blazor WebAssembly apps can be debugged:
- In Visual Studio or Visual Studio Code.
- Using browser developer tools in Chromium-based browsers, including Microsoft Edge and Google Chrome.
Unsupported scenarios for Blazor WebAssembly apps include:
- Set and remove breakpoints.
- Run the app with debugging support in IDEs.
- Single-step through the code.
- Resume code execution with a keyboard shortcut in IDEs.
- In the Locals window, observe the values of local variables.
- See the call stack, including call chains between JavaScript and .NET.
- Debug in non-local scenarios (for example, Windows Subsystem for Linux (WSL) or Visual Studio Codespaces).
- Use a symbol server for debugging.
Blazor Server apps can be debugged in Visual Studio or Visual Studio Code.
Blazor WebAssembly apps can be debugged:
- In Visual Studio or Visual Studio Code.
- Using browser developer tools in Chromium-based browsers, including Microsoft Edge and Google Chrome.
Unsupported scenarios for Blazor WebAssembly apps include:
- Set and remove breakpoints.
- Run the app with debugging support in IDEs.
- Single-step through the code.
- Resume code execution with a keyboard shortcut in IDEs.
- In the Locals window, observe the values of local variables.
- See the call stack, including call chains between JavaScript and .NET.
- Hit breakpoints during app startup before the debug proxy is running. This includes breakpoints in the
Programfile and breakpoints in theOnInitialized{Async}lifecycle methods of components that are loaded by the first page requested from the app. - Debug in non-local scenarios (for example, Windows Subsystem for Linux (WSL) or Visual Studio Codespaces).
- Use a symbol server for debugging.
Prerequisites
This section explains the prerequisites for debugging.
Browser prerequisites
The latest version of the following browsers:
- Google Chrome
- Microsoft Edge
- Firefox (browser developer tools only)
Debugging requires the latest version of the following browsers:
- Google Chrome (default)
- Microsoft Edge
Ensure that firewalls or proxies don't block communication with the debug proxy (NodeJS process). For more information, see the Firewall configuration section.
Note
Apple Safari on macOS isn't currently supported.
IDE prerequisites
The latest version of Visual Studio or Visual Studio Code is required.
Visual Studio Code prerequisites
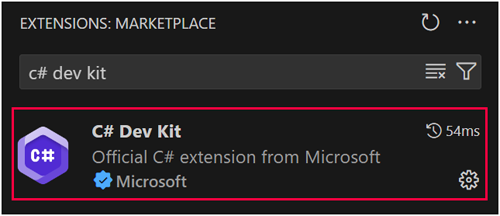
Visual Studio Code requires the C# Dev Kit for Visual Studio Code (Getting Started with C# in VS Code). In the Visual Studio Code Extensions Marketplace, filter the extension list with "c# dev kit" to locate the extension:
Installing the C# Dev Kit automatically installs the following additional extensions:
If you encounter warnings or errors, you can open an issue (microsoft/vscode-dotnettools GitHub repository) describing the problem.
App configuration prerequisites
The guidance in this subsection applies to client-side debugging.
Open the Properties/launchSettings.json file of the startup project. Confirm the presence of the following inspectUri property in each launch profile of the file's profiles node. If the following property isn't present, add it to each profile:
"inspectUri": "{wsProtocol}://{url.hostname}:{url.port}/_framework/debug/ws-proxy?browser={browserInspectUri}"
The inspectUri property:
- Enables the IDE to detect that the app is a Blazor app.
- Instructs the script debugging infrastructure to connect to the browser through Blazor's debugging proxy.
The placeholder values for the WebSocket protocol (wsProtocol), host (url.hostname), port (url.port), and inspector URI on the launched browser (browserInspectUri) are provided by the framework.
Packages
Blazor Web Apps: Microsoft.AspNetCore.Components.WebAssembly.Server: References an internal package (Microsoft.NETCore.BrowserDebugHost.Transport) for assemblies that share the browser debug host.
Blazor Server: Microsoft.AspNetCore.Components.WebAssembly.Server: References an internal package (Microsoft.NETCore.BrowserDebugHost.Transport) for assemblies that share the browser debug host.
Standalone Blazor WebAssembly: Microsoft.AspNetCore.Components.WebAssembly.DevServer: Development server for use when building Blazor apps. Calls UseWebAssemblyDebugging internally to add middleware for debugging Blazor WebAssembly apps inside Chromium developer tools.
Hosted Blazor WebAssembly:
- Client project:
Microsoft.AspNetCore.Components.WebAssembly.DevServer: Development server for use when building Blazor apps. Calls UseWebAssemblyDebugging internally to add middleware for debugging Blazor WebAssembly apps inside Chromium developer tools. - Server project:
Microsoft.AspNetCore.Components.WebAssembly.Server: References an internal package (Microsoft.NETCore.BrowserDebugHost.Transport) for assemblies that share the browser debug host.
Note
For guidance on adding packages to .NET apps, see the articles under Install and manage packages at Package consumption workflow (NuGet documentation). Confirm correct package versions at NuGet.org.
Debug a Blazor Web App in an IDE
The example in this section assumes that you've created a Blazor Web App with an interactive render mode of Auto (Server and WebAssembly) and per-component interactivity location.
- Open the app.
- Set a breakpoint on the
currentCount++;line in theCountercomponent (Pages/Counter.razor) of the client project (.Client). - With the server project selected in Solution Explorer, press F5 to run the app in the debugger.
- In the browser, navigate to
Counterpage at/counter. Wait a few seconds for the debug proxy to load and run. Select the Click me button to hit the breakpoint. - In Visual Studio, inspect the value of the
currentCountfield in the Locals window. - Press F5 to continue execution.
Breakpoints can also be hit in the server project in statically-rendered and interactively-rendered server-side components.
- Stop the debugger.
- In the server app, open the statically-rendered
Weathercomponent (Components/Pages/Weather.razor) and set a breakpoint anywhere in theOnInitializedAsyncmethod. - Press F5 to run the app in the debugger.
- In the browser, navigate to the
Weatherpage at/weather. Wait a few seconds for the debug proxy to load and run. Application execution stops at the breakpoint. - Press F5 to continue execution.
Breakpoints are not hit during app startup before the debug proxy is running. This includes breakpoints in the Program file and breakpoints in the OnInitialized{Async} lifecycle methods of components that are loaded by the first page requested from the app.
Debug a Blazor Server app in an IDE
- Open the app.
- Set a breakpoint on the
currentCount++;line in theCountercomponent (Pages/Counter.razor). - Press F5 to run the app in the debugger.
- In the browser, navigate to
Counterpage at/counter. Wait a few seconds for the debug proxy to load and run. Select the Click me button to hit the breakpoint. - In Visual Studio, inspect the value of the
currentCountfield in the Locals window. - Press F5 to continue execution.
Breakpoints are not hit during app startup before the debug proxy is running. This includes breakpoints in the Program file and breakpoints in the OnInitialized{Async} lifecycle methods of components that are loaded by the first page requested from the app.
Debug a Blazor WebAssembly app in an IDE
- Open the app.
- Set a breakpoint on the
currentCount++;line in theCountercomponent (Pages/Counter.razor). - Press F5 to run the app in the debugger.
- In the browser, navigate to
Counterpage at/counter. Wait a few seconds for the debug proxy to load and run. Select the Click me button to hit the breakpoint. - In Visual Studio, inspect the value of the
currentCountfield in the Locals window. - Press F5 to continue execution.
Breakpoints are not hit during app startup before the debug proxy is running. This includes breakpoints in the Program file and breakpoints in the OnInitialized{Async} lifecycle methods of components that are loaded by the first page requested from the app.
Debug a hosted Blazor WebAssembly app in an IDE
With the Server project selected in Solution Explorer, press F5 to run the app in the debugger.
When debugging with a Chromium-based browser, such as Google Chrome or Microsoft Edge, a new browser window might open with a separate profile for the debugging session instead of opening a tab in an existing browser window with the user's profile. If debugging with the user's profile is a requirement, adopt one of the following approaches:
- Close all open browser instances before pressing F5 to start debugging.
- Configure Visual Studio to launch the browser with the user's profile. For more information on this approach, see Blazor WASM Debugging in VS launches Edge with a separate user data directory (dotnet/aspnetcore #20915).
In the Client project, set a breakpoint on the
currentCount++;line in theCountercomponent (Pages/Counter.razor).In the browser, navigate to
Counterpage at/counter. Wait a few seconds for the debug proxy to load and run. Select the Click me button to hit the breakpoint.In Visual Studio, inspect the value of the
currentCountfield in the Locals window.Press F5 to continue execution.
You can also debug server code in the Server project:
- Set a breakpoint in the
Pages/FetchData.razorpage in OnInitializedAsync. - Set a breakpoint in the
WeatherForecastControllerin theGetaction method. - Browse to the
Fetch Datapage to hit the first breakpoint in theFetchDatacomponent just before it issues an HTTP request to the server. - Press F5 to continue execution and then hit the breakpoint on the server in the
WeatherForecastController. - Press F5 again to let execution continue and see the weather forecast table rendered in the browser.
Breakpoints are not hit during app startup before the debug proxy is running. This includes breakpoints in the Program file and breakpoints in the OnInitialized{Async} lifecycle methods of components that are loaded by the first page requested from the app.
Attach to an existing Visual Studio Code debugging session
To attach to a running Blazor app, open the .vscode/launch.json file and replace the {URL} placeholder with the URL where the app is running:
{
  "name": "Attach and Debug",
  "type": "blazorwasm",
  "request": "attach",
  "url": "{URL}"
}
Visual Studio Code launch options
The launch configuration options in the following table are supported for the blazorwasm debug type (.vscode/launch.json).
| Option | Description |
|---|---|
browser |
The browser to launch for the debugging session. Set to edge or chrome. Defaults to edge. |
cwd |
The working directory to launch the app under. |
request |
Use launch to launch and attach a debugging session to a Blazor WebAssembly app or attach to attach a debugging session to an already-running app. |
timeout |
The number of milliseconds to wait for the debugging session to attach. Defaults to 30,000 milliseconds (30 seconds). |
trace |
Used to generate logs from the JS debugger. Set to true to generate logs. |
url |
The URL to open in the browser when debugging. |
webRoot |
Specifies the absolute path of the web server. Should be set if an app is served from a sub-route. |
The additional options in the following table only apply to hosted Blazor WebAssembly apps.
| Option | Description |
|---|---|
env |
The environment variables to provide to the launched process. Only applicable if hosted is set to true. |
hosted |
Must be set to true if launching and debugging a hosted Blazor WebAssembly app. |
program |
A reference to the executable to run the server of the hosted app. Must be set if hosted is true. |
Debug Blazor WebAssembly with Google Chrome or Microsoft Edge
The guidance in this section applies debugging Blazor WebAssembly apps in:
- Google Chrome running on Windows or macOS.
- Microsoft Edge running on Windows.
Run the app in a command shell with
dotnet watch(ordotnet run).Launch a browser and navigate to the app's URL.
Start remote debugging by pressing:
- Shift+Alt+d on Windows.
- Shift+⌘+d on macOS.
The browser must be running with remote debugging enabled, which isn't the default. If remote debugging is disabled, an Unable to find debuggable browser tab error page is rendered with instructions for launching the browser with the debugging port open. Follow the instructions for your browser.
After following the instructions to enable remote debugging, the app opens in a new browser window. Start remote debugging by pressing the HotKey combination in the new browser window:
- Shift+Alt+d on Windows.
- Shift+⌘+d on macOS.
A new window developer tools browser tab opens showing a ghosted image of the app.
Note
If you followed the instructions to open a new browser tab with remote debugging enabled, you can close the original browser window, leaving the second window open with the first tab running the app and the second tab running the debugger.
After a moment, the Sources tab shows a list of the app's .NET assemblies and pages.
Open the
file://node. In component code (.razorfiles) and C# code files (.cs), breakpoints that you set are hit when code executes in the app's browser tab (the initial tab opened after starting remote debugging). After a breakpoint is hit, single-step (F10) through the code or resume (F8) code execution normally in the debugging tab.
For Chromium-based browser debugging, Blazor provides a debugging proxy that implements the Chrome DevTools Protocol and augments the protocol with .NET-specific information. When debugging keyboard shortcut is pressed, Blazor points the Chrome DevTools at the proxy. The proxy connects to the browser window you're seeking to debug (hence the need to enable remote debugging).
Debug a Blazor WebAssembly app with Firefox
The guidance in this section applies debugging Blazor WebAssembly apps in Firefox running on Windows.
Debugging a Blazor WebAssembly app with Firefox requires configuring the browser for remote debugging and connecting to the browser using the browser developer tools through the .NET WebAssembly debugging proxy.
Note
Debugging in Firefox from Visual Studio isn't supported at this time.
To debug a Blazor WebAssembly app in Firefox during development:
- Configure Firefox:
- Open
about:configin a new browser tab. Read and dismiss the warning that appears. - Enable
devtools.debugger.remote-enabledby setting its value toTrue. - Enable
devtools.chrome.enabledby setting its value toTrue. - Disable
devtools.debugger.prompt-connectionby setting its value toFalse.
- Open
- Close all Firefox instances.
- Run the app in a command shell with
dotnet watch(ordotnet run). - Relaunch the Firefox browser and navigate to the app.
- Open
about:debuggingin a new browser tab. Leave this tab open. - Go back to the tab where the app is running. Start remote debugging by pressing Shift+Alt+d.
- In the
Debuggertab, open the app source file you wish to debug under thefile://node and set a breakpoint. For example, set a breakpoint on thecurrentCount++;line in theIncrementCountmethod of theCountercomponent (Pages/Counter.razor). - Navigate to the
Countercomponent page (/counter) in the app's browser tab and select the counter button to hit the breakpoint. - Press F5 to continue execution in the debugging tab.
Break on unhandled exceptions
The debugger doesn't break on unhandled exceptions because Blazor catches exceptions that are unhandled by developer code.
To break on unhandled exceptions:
- Open the debugger's exception settings (Debug > Windows > Exception Settings) in Visual Studio.
- Set the following JavaScript Exceptions settings:
- All Exceptions
- Uncaught Exceptions
Browser source maps
Browser source maps allow the browser to map compiled files back to their original source files and are commonly used for client-side debugging. However, Blazor doesn't currently map C# directly to JavaScript/Wasm. Instead, Blazor does IL interpretation within the browser, so source maps aren't relevant.
Firewall configuration
If a firewall blocks communication with the debug proxy, create a firewall exception rule that permits communication between the browser and the NodeJS process.
Warning
Modification of a firewall configuration must be made with care to avoid creating security vulnerabilities. Carefully apply security guidance, follow best security practices, and respect warnings issued by the firewall's manufacturer.
Permitting open communication with the NodeJS process:
- Opens up the Node server to any connection, depending on the firewall's capabilities and configuration.
- Might be risky depending on your network.
- Is only recommended on developer machines.
If possible, only allow open communication with the NodeJS process on trusted or private networks.
For Windows Firewall configuration guidance, see Create an Inbound Program or Service Rule. For more information, see Windows Defender Firewall with Advanced Security and related articles in the Windows Firewall documentation set.
Troubleshoot
If you're running into errors, the following tips may help:
- Remove breakpoints:
- Google Chrome: In the Debugger tab, open the developer tools in your browser. In the console, execute
localStorage.clear()to remove any breakpoints. - Microsoft Edge: In the Application tab, open Local storage. Right-click the site and select Clear.
- Google Chrome: In the Debugger tab, open the developer tools in your browser. In the console, execute
- Confirm that you've installed and trusted the ASP.NET Core HTTPS development certificate. For more information, see Enforce HTTPS in ASP.NET Core.
- Visual Studio requires the Enable JavaScript debugging for ASP.NET (Chrome and Edge) option in Tools > Options > Debugging > General. This is the default setting for Visual Studio. If debugging isn't working, confirm that the option is selected.
- If your environment uses an HTTP proxy, make sure that
localhostis included in the proxy bypass settings. This can be done by setting theNO_PROXYenvironment variable in either:- The
launchSettings.jsonfile for the project. - At the user or system environment variables level for it to apply to all apps. When using an environment variable, restart Visual Studio for the change to take effect.
- The
- Ensure that firewalls or proxies don't block communication with the debug proxy (
NodeJSprocess). For more information, see the Firewall configuration section.
Breakpoints in OnInitialized{Async} not hit
The Blazor framework's debugging proxy doesn't launch instantly on app startup, so breakpoints in the OnInitialized{Async} lifecycle methods might not be hit. We recommend adding a delay at the start of the method body to give the debug proxy some time to launch before the breakpoint is hit. You can include the delay based on an if compiler directive to ensure that the delay isn't present for a release build of the app.
protected override void OnInitialized()
{
#if DEBUG
    Thread.Sleep(10000);
#endif

    ...
}
protected override async Task OnInitializedAsync()
{
#if DEBUG
    await Task.Delay(10000);
#endif

    ...
}
Visual Studio (Windows) timeout
If Visual Studio throws an exception that the debug adapter failed to launch mentioning that the timeout was reached, you can adjust the timeout with a Registry setting:
VsRegEdit.exe set "<VSInstallFolder>" HKCU JSDebugger\Options\Debugging "BlazorTimeoutInMilliseconds" dword {TIMEOUT}
The {TIMEOUT} placeholder in the preceding command is in milliseconds. For example, one minute is assigned as 60000.
Control Hot Reload
The WasmEnableHotReload MSBuild property enables Hot Reload and is set to true by default when building in the Debug configuration. Hot Reload isn't enabled (set to false) when building in any other configuration.
To use a custom configuration name when debugging, for example, DebugWebAssembly, set the property to true to enable Hot Reload:
<PropertyGroup>
  <WasmEnableHotReload>true</WasmEnableHotReload>
</PropertyGroup>
To disable Hot Reload for the Debug configuration, set the value to false:
<PropertyGroup>
  <WasmEnableHotReload>false</WasmEnableHotReload>
</PropertyGroup>
Collaborate with us on GitHub
The source for this content can be found on GitHub, where you can also create and review issues and pull requests. For more information, see our contributor guide.
ASP.NET Core