Use browser developer tools with ASP.NET Core Blazor Hybrid
Note
This isn't the latest version of this article. For the current release, see the .NET 8 version of this article.
Warning
This version of ASP.NET Core is no longer supported. For more information, see .NET and .NET Core Support Policy. For the current release, see the .NET 8 version of this article.
Important
This information relates to a pre-release product that may be substantially modified before it's commercially released. Microsoft makes no warranties, express or implied, with respect to the information provided here.
For the current release, see the .NET 8 version of this article.
This article explains how to use browser developer tools with Blazor Hybrid apps.
Browser developer tools with .NET MAUI Blazor
Ensure the Blazor Hybrid project is configured to support browser developer tools. You can confirm developer tools support by searching the app for AddBlazorWebViewDeveloperTools.
If the project isn't already configured for browser developer tools, add support by:
Locating where the call to AddMauiBlazorWebView is made, likely within the app's
MauiProgram.csfile.At the top of the
MauiProgram.csfile, confirm the presence of ausingstatement for Microsoft.Extensions.Logging. If theusingstatement isn't present, add it to the top of the file:using Microsoft.Extensions.Logging;After the call to AddMauiBlazorWebView, add the following code:
#if DEBUG
    builder.Services.AddBlazorWebViewDeveloperTools();
    builder.Logging.AddDebug();
#endif
To use browser developer tools with a Windows app:
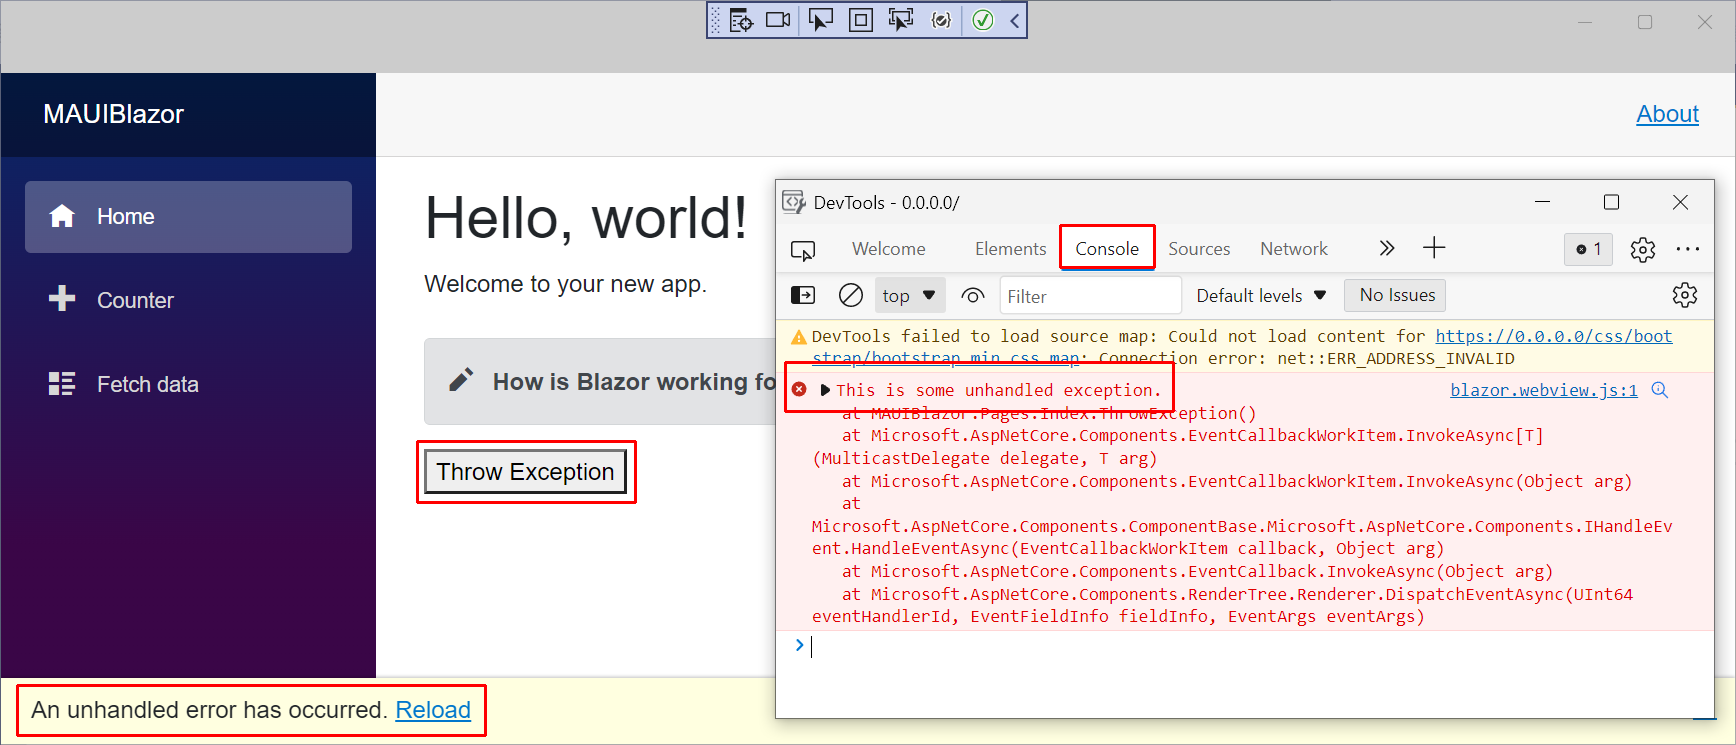
Run the .NET MAUI Blazor Hybrid app for Windows and navigate to an app page that uses a BlazorWebView. The developer tools console is unavailable from ContentPages without a Blazor Web View.
Use the keyboard shortcut Ctrl+Shift+I to open browser developer tools.
Developer tools provide a variety of features for working with apps, including which assets the page requested, how long assets took to load, and the content of loaded assets. The following example shows the Console tab to see the console messages, which includes any exception messages generated by the framework or developer code:
To use browser developer tools with an Android app:
Start the Android emulator and navigate to an app page that uses a BlazorWebView. The developer tools console is unavailable from ContentPages without a Blazor Web View.
Open Google Chrome or Microsoft Edge.
Navigate to
chrome://inspect/#devices(Google Chrome) oredge://inspect/#devices(Microsoft Edge).Select the
inspectlink button to open developer tools. The following example shows the DevTools page in Microsoft Edge: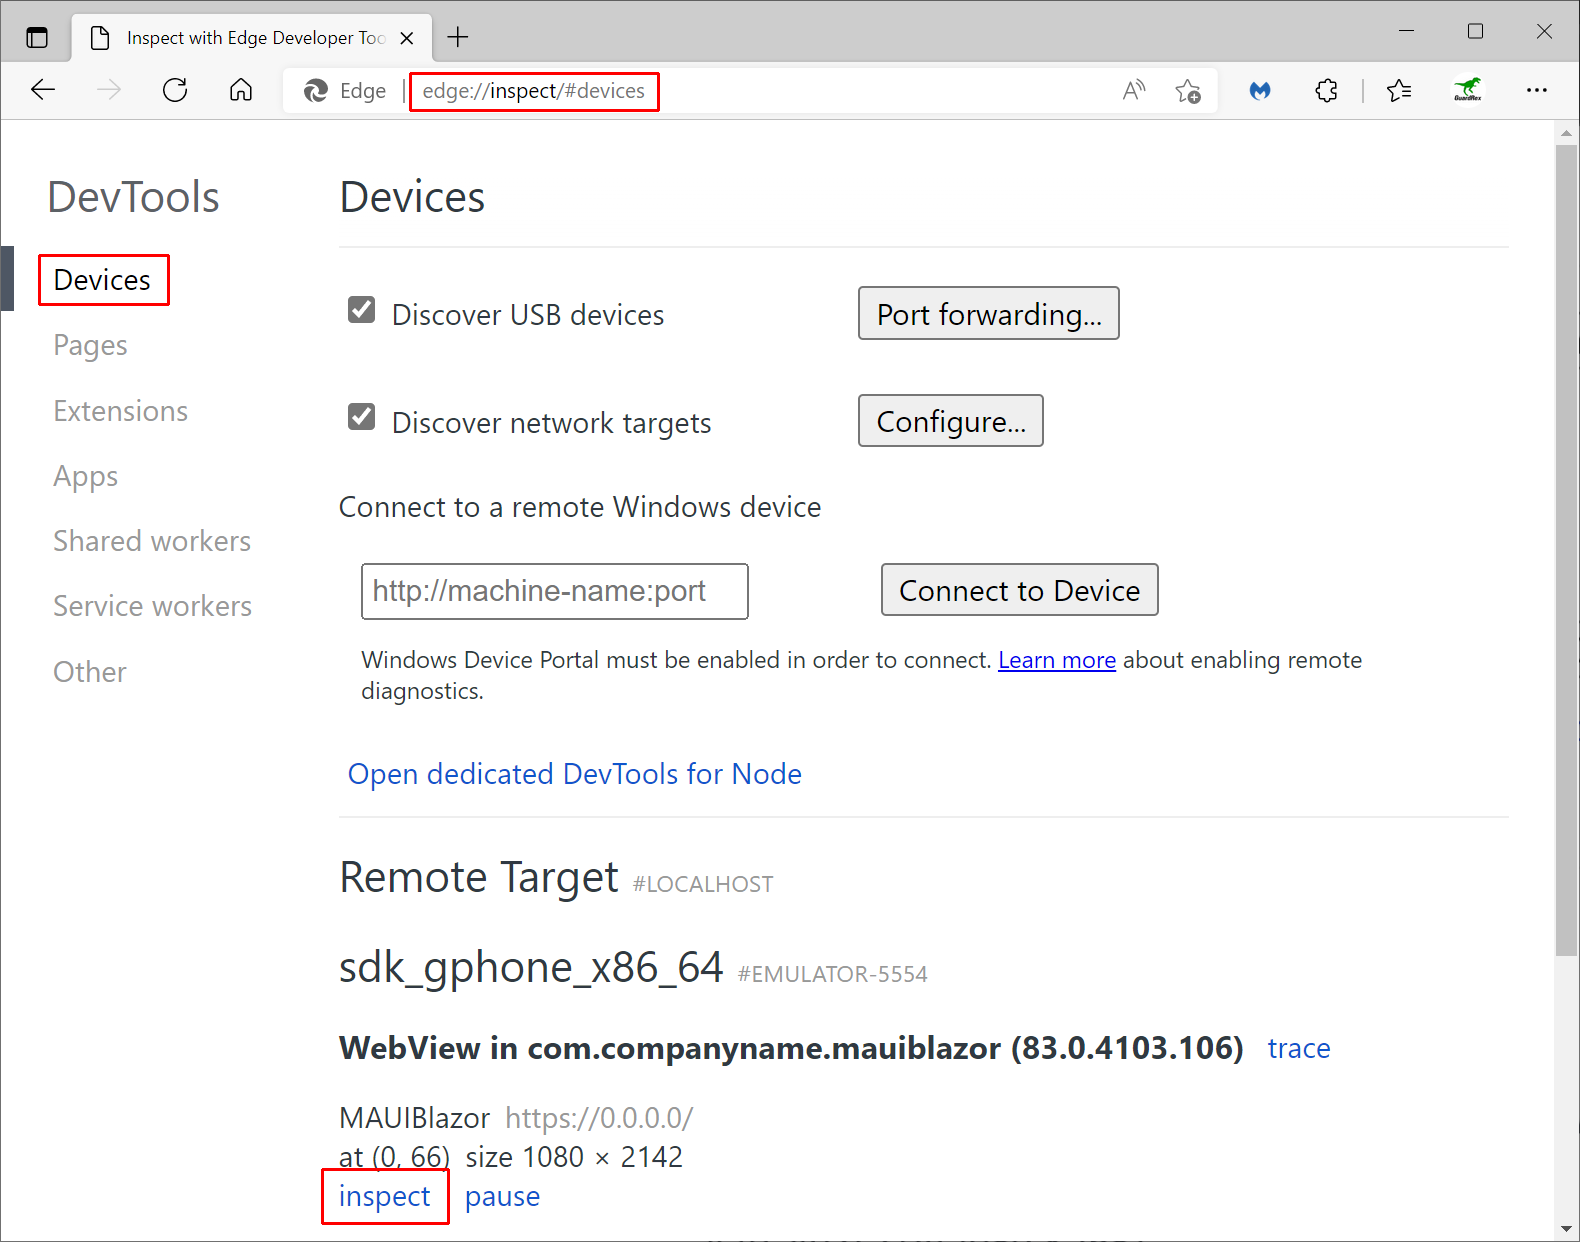
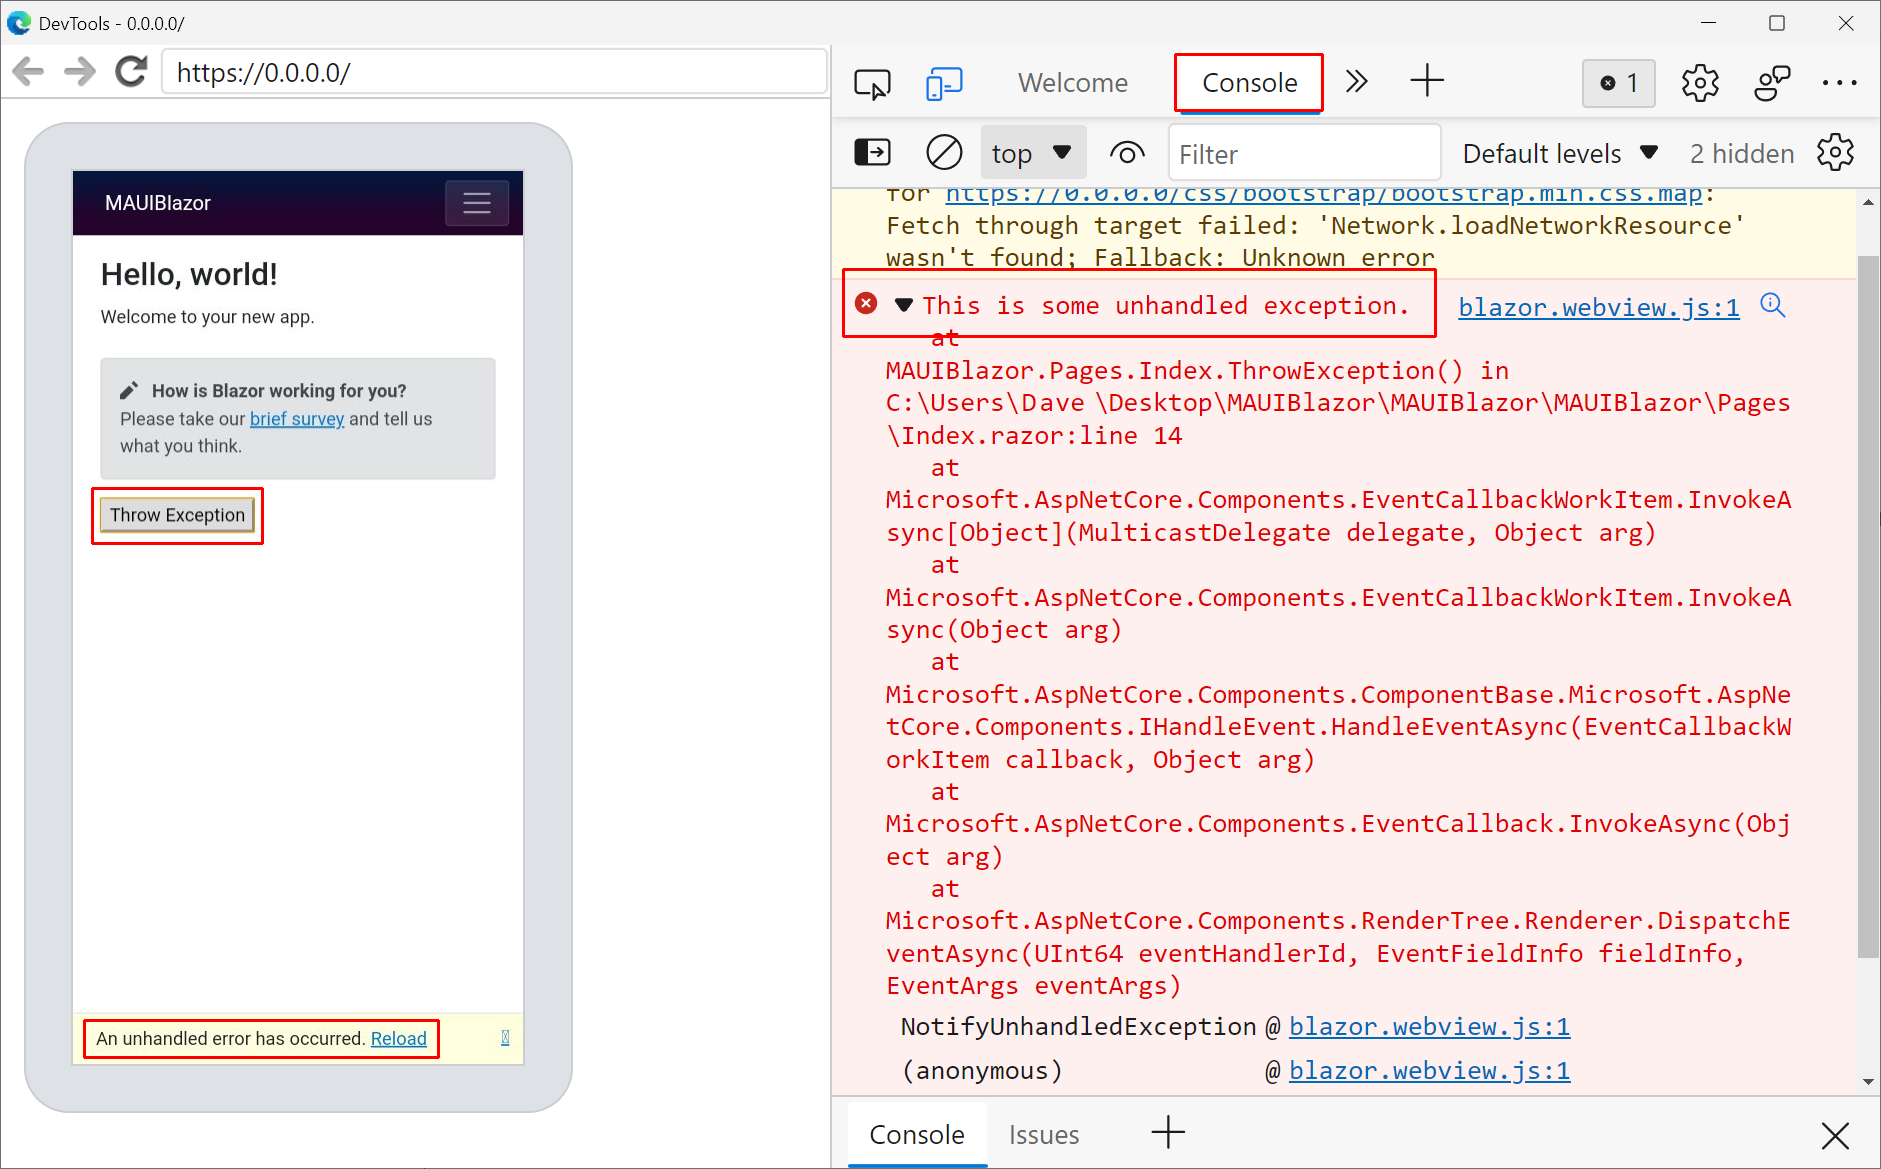
Developer tools provide a variety of features for working with apps, including which assets the page requested, how long assets took to load, and the content of loaded assets. The following example shows the Console tab to see the console messages, which includes any exception messages generated by the framework or developer code:
To use Safari developer tools with an iOS app:
Open desktop Safari.
Select the Safari > Preferences > Advanced > Show Develop menu in the menu bar checkbox.
Run the .NET MAUI Blazor Hybrid app in the iOS simulator and navigate to an app page that uses a BlazorWebView. The developer tools console is unavailable from ContentPages without a Blazor Web View.
Return to Safari. Select Develop > {REMOTE INSPECTION TARGET} > 0.0.0.0, where the
{REMOTE INSPECTION TARGET}placeholder is either the devices's plain name (for example,MacBook Pro) or the device's serial number (for exampleXMVM7VFF10). If multiple entries for 0.0.0.0 are present, select the entry that highlights the BlazorWebView. The BlazorWebView is highlighted in blue in the iOS simulator when the correct 0.0.0.0 entry is selected.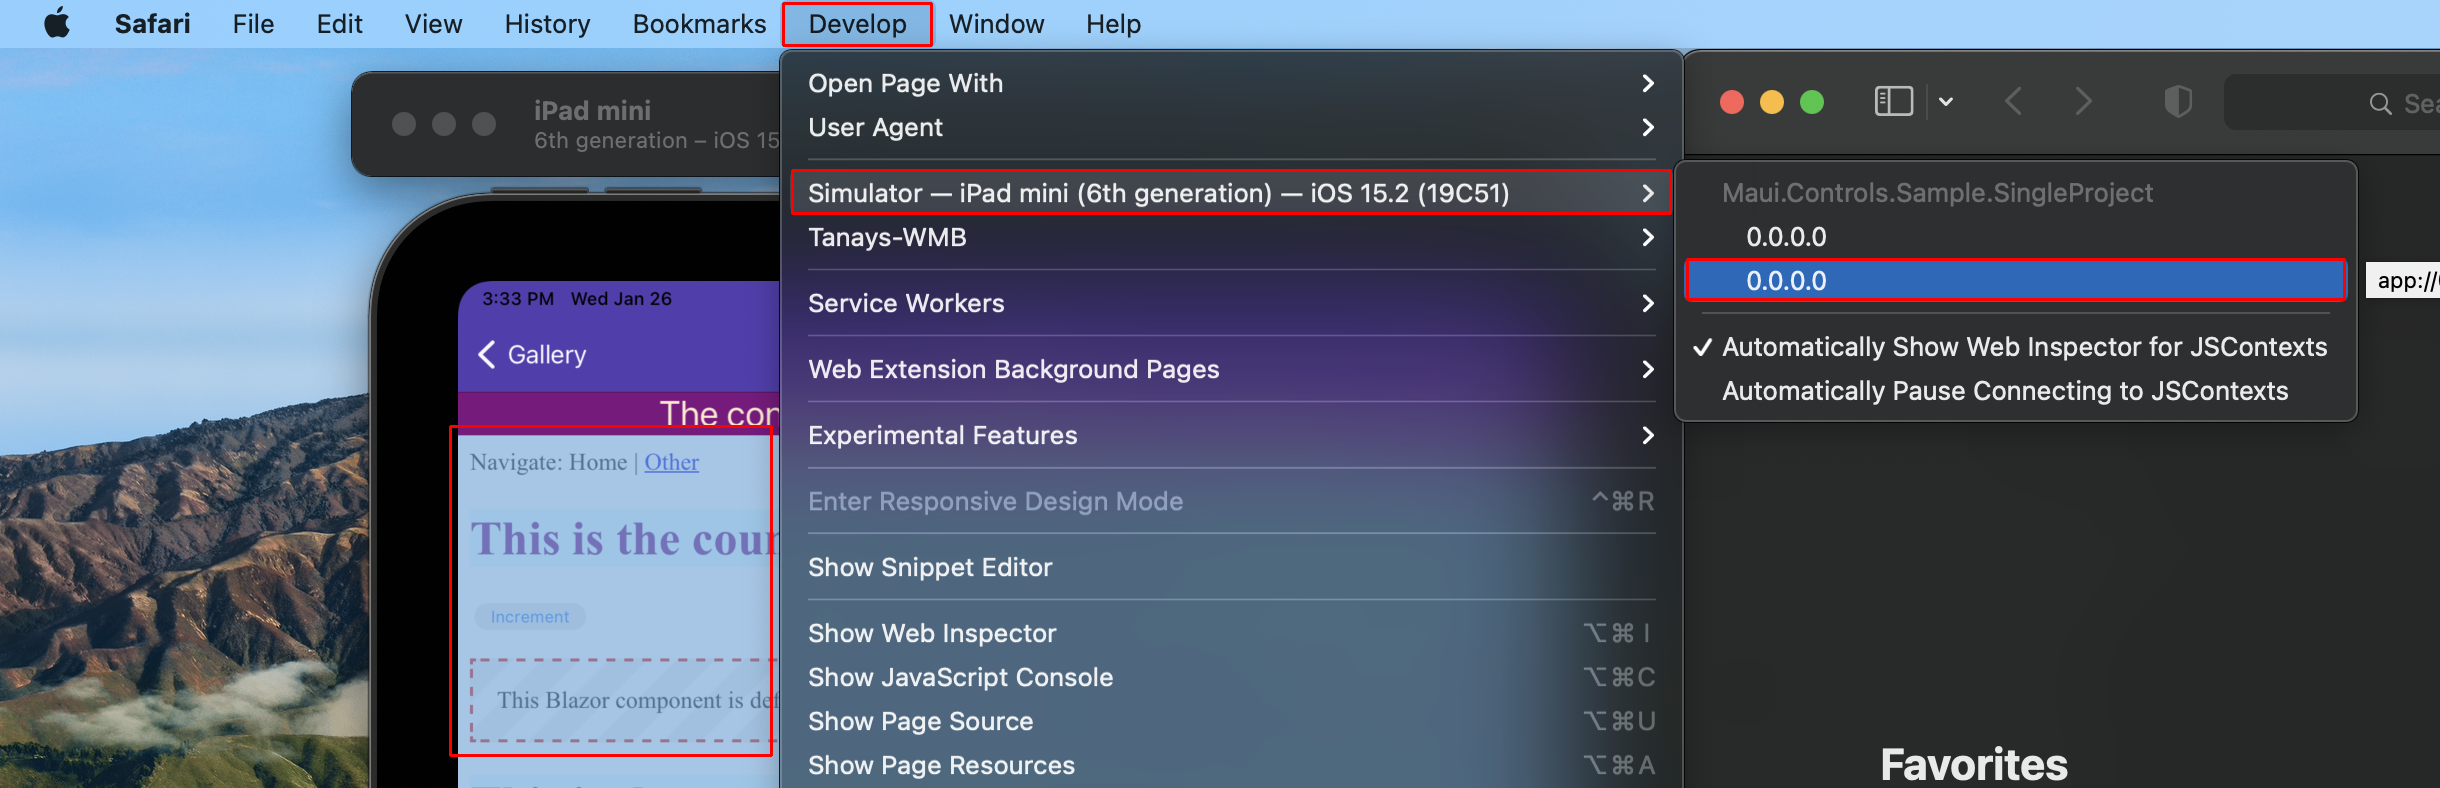
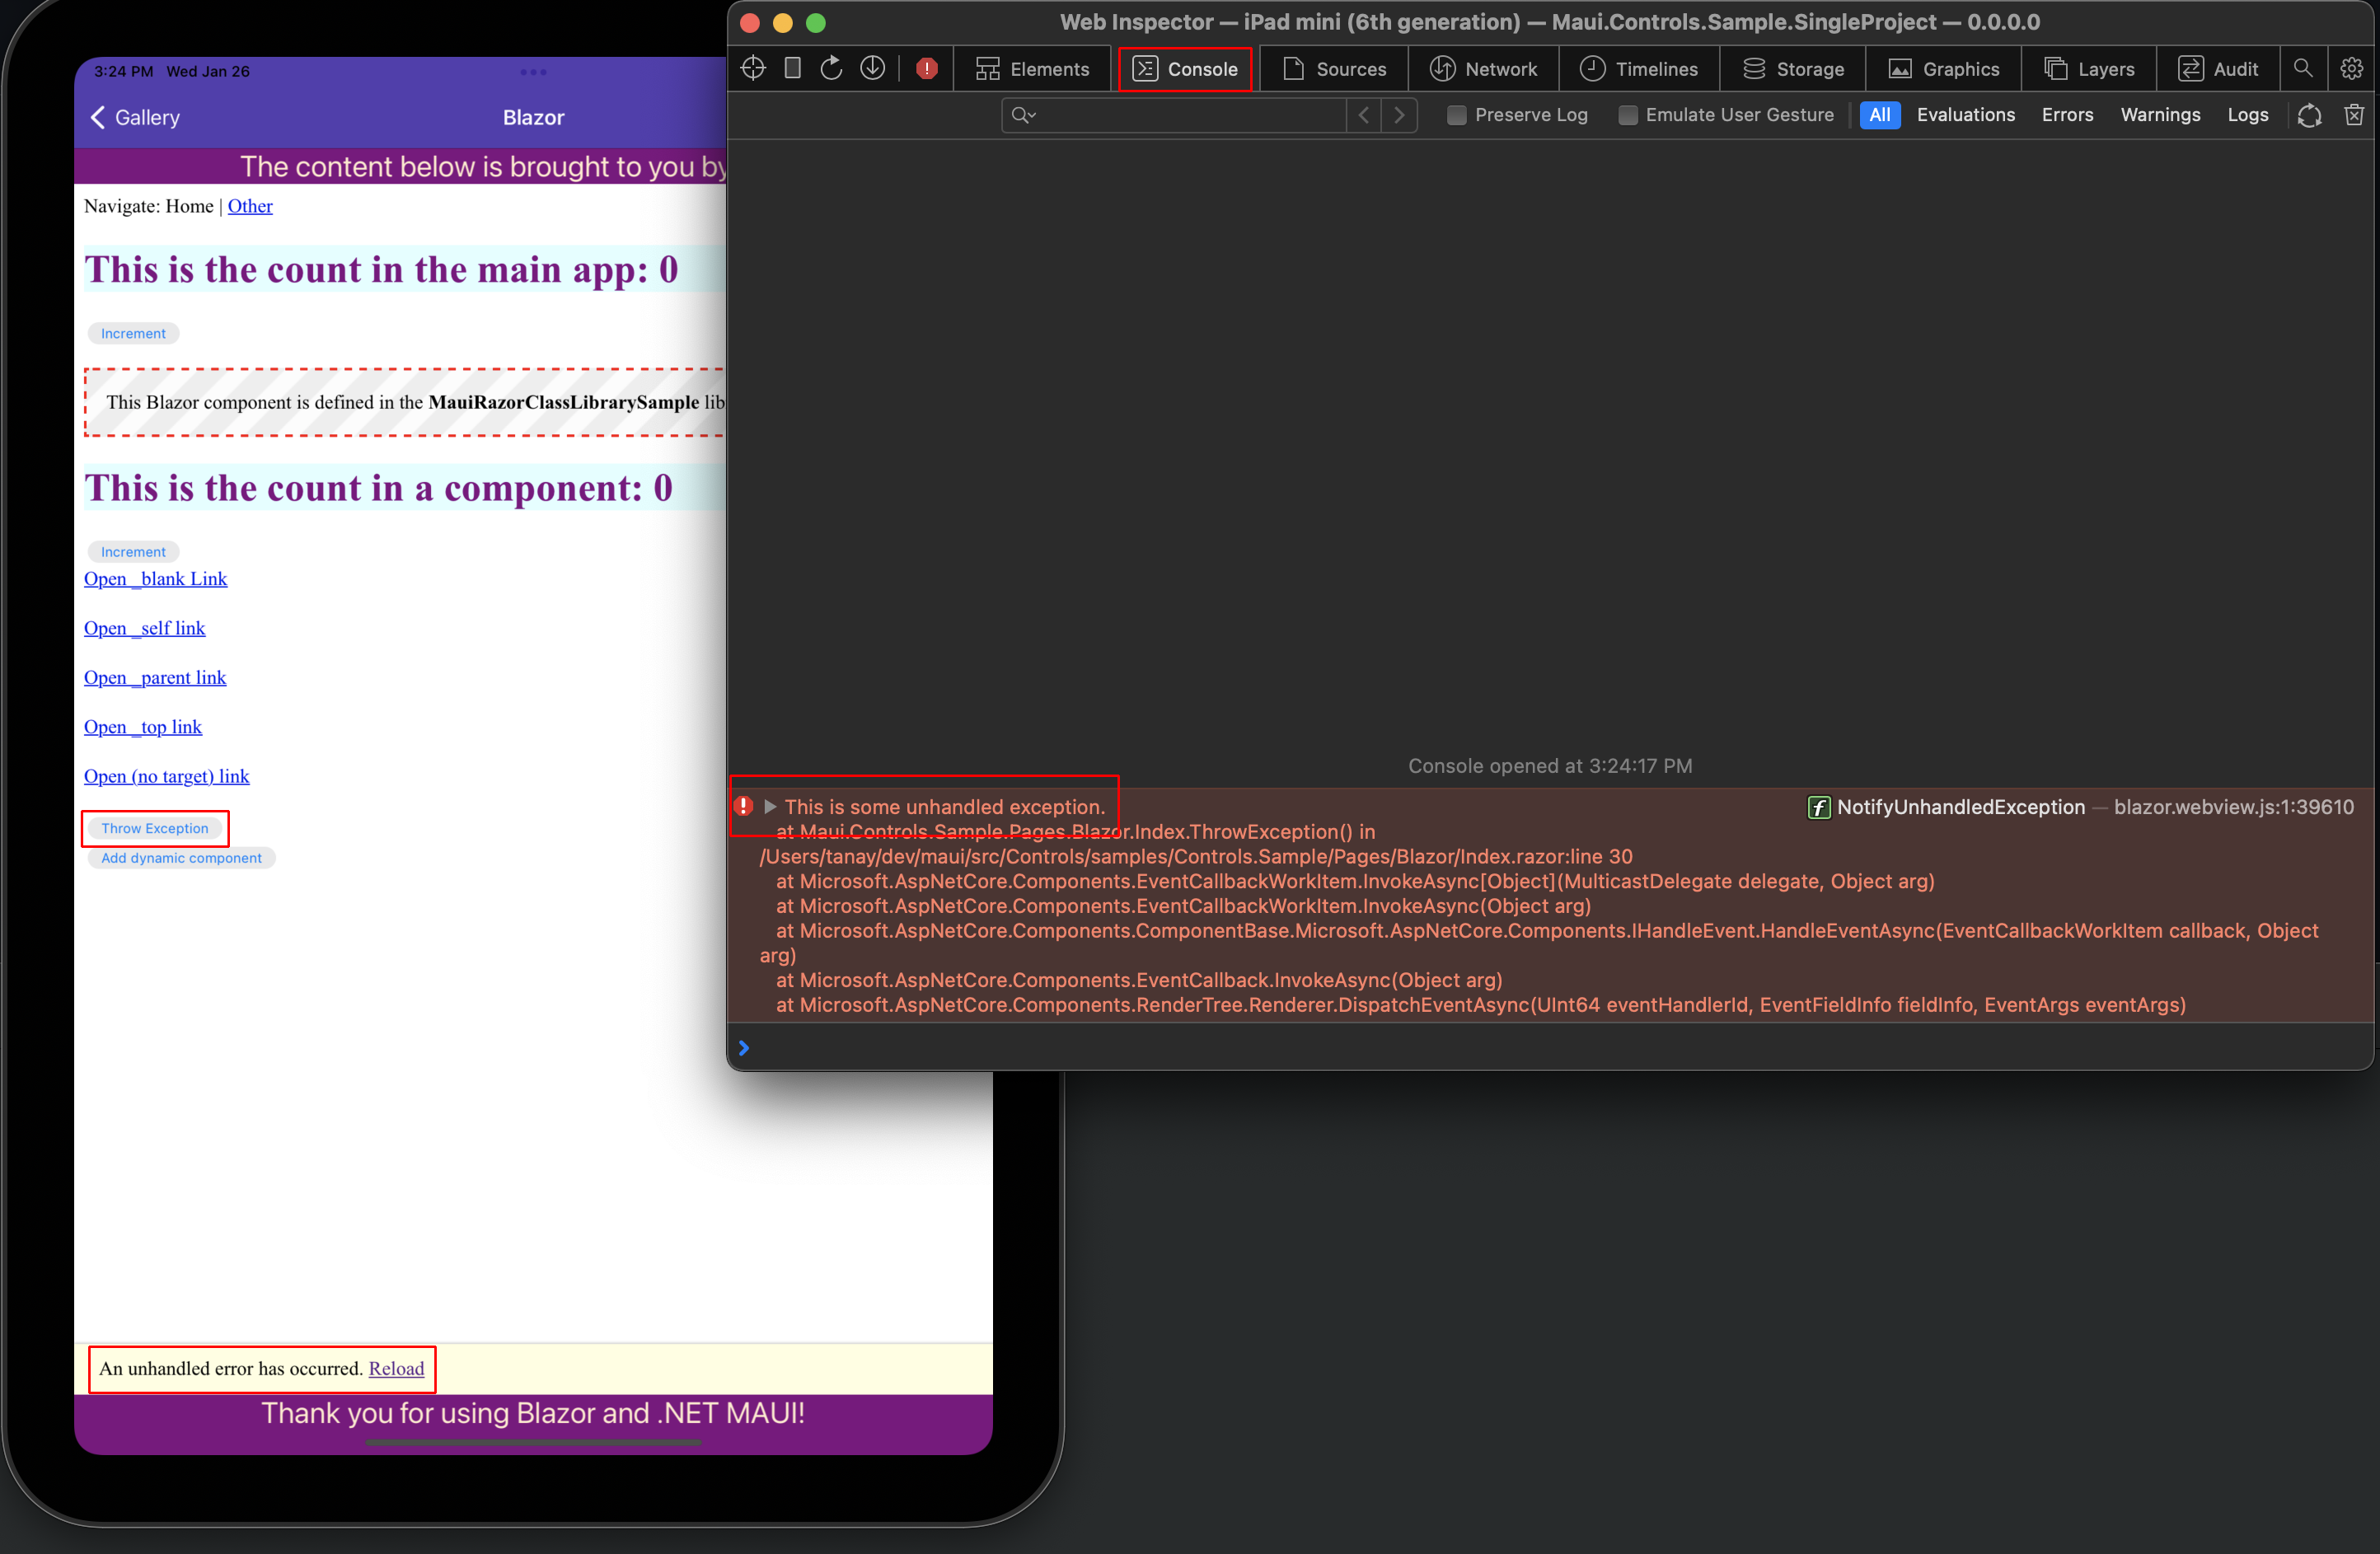
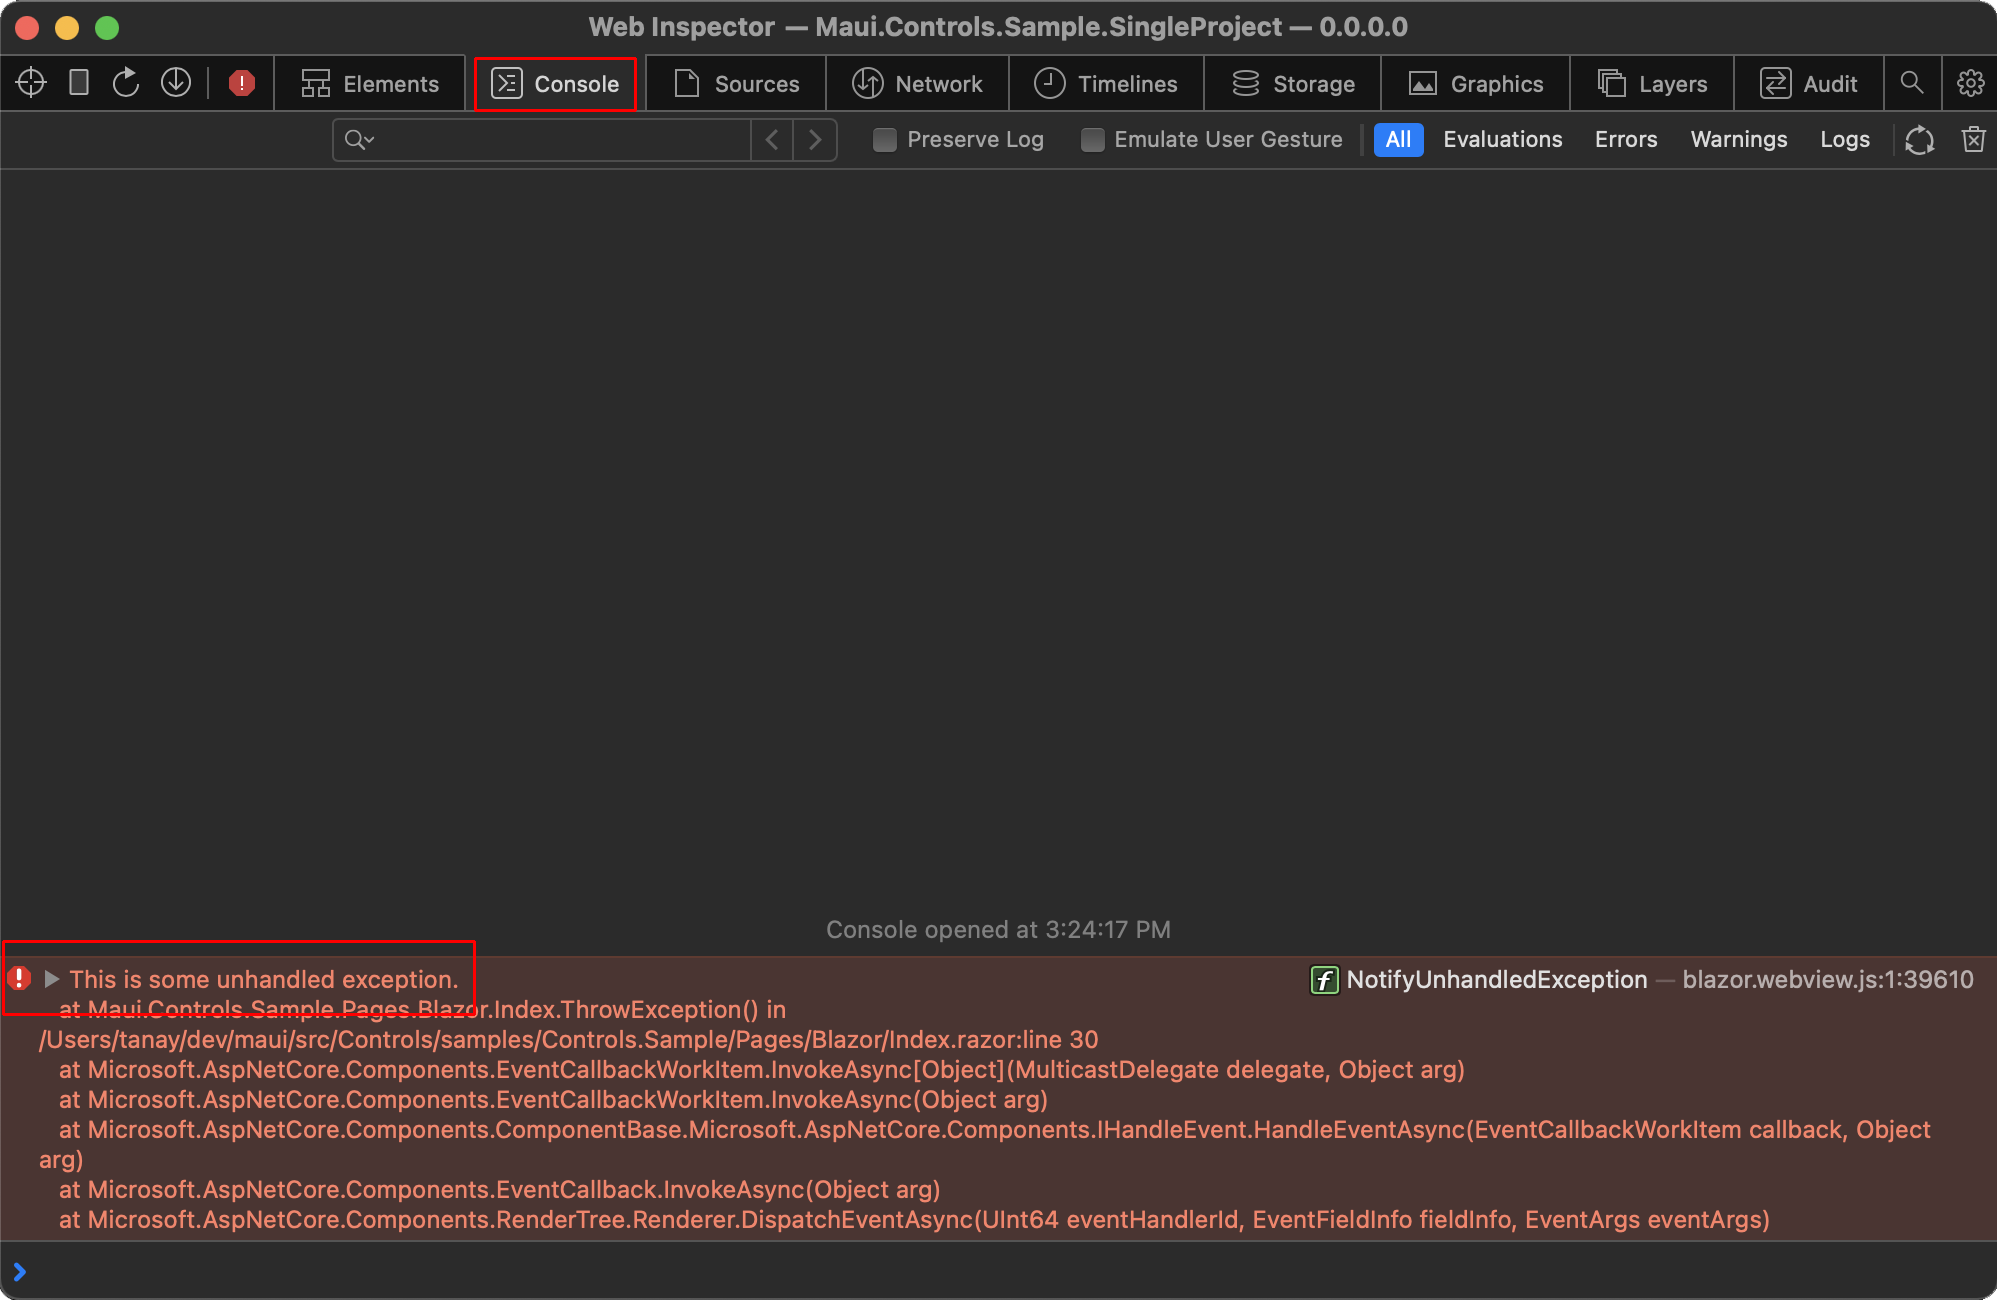
The Web Inspector window appears for the BlazorWebView.
Developer tools provide a variety of features for working with apps, including which assets the page requested, how long assets took to load, and the content of loaded assets. The following example shows the Console tab, which includes any exception messages generated by the framework or developer code:
Add the com.apple.security.get-task-allow key, of type Boolean, to the entitlements file of the app for its debug build.
To add an entitlements file with the com.apple.security.get-task-allow key, add the following XML file named Entitlements.Debug.plist to the Platforms/MacCatalyst folder of the project.
Platforms/MacCatalyst/Entitlements.Debug.plist:
<?xml version="1.0" encoding="UTF-8"?>
<!DOCTYPE plist PUBLIC "-//Apple//DTD PLIST 1.0//EN" "http://www.apple.com/DTDs/PropertyList-1.0.dtd">
<plist version="1.0">
<dict>
    <key>com.apple.security.get-task-allow</key>
    <true/>
</dict>
</plist>
To consume the entitlements file for debug builds on Mac Catalyst, add the following <PropertyGroup> node to the app's project file as a child of the <Project> node:
<PropertyGroup Condition="$([MSBuild]::GetTargetPlatformIdentifier('$(TargetFramework)')) == 'maccatalyst' and '$(Configuration)' == 'Debug'">
    <CodeSignEntitlements>Platforms/MacCatalyst/Entitlements.Debug.plist</CodeSignEntitlements>
</PropertyGroup>
To use Safari developer tools with a macOS app:
Open desktop Safari.
Select the Safari > Preferences > Advanced > Show Develop menu in the menu bar checkbox.
Run the .NET MAUI Blazor Hybrid app in macOS.
Return to Safari. Select Develop > {REMOTE INSPECTION TARGET} > 0.0.0.0, where the
{REMOTE INSPECTION TARGET}placeholder is either the devices's plain name (for example,MacBook Pro) or the device's serial number (for exampleXMVM7VFF10). If multiple entries for 0.0.0.0 are present, select the entry that highlights the BlazorWebView. The BlazorWebView is highlighted in blue in macOS when the correct 0.0.0.0 entry is selected.The Web Inspector window appears for the BlazorWebView.
Developer tools provide a variety of features for working with apps, including which assets the page requested, how long assets took to load, and the content of loaded assets. The following example shows the Console tab, which includes any exception messages generated by the framework or developer code:
Additional resources
ASP.NET Core
Feedback
Coming soon: Throughout 2024 we will be phasing out GitHub Issues as the feedback mechanism for content and replacing it with a new feedback system. For more information see: https://aka.ms/ContentUserFeedback.
Submit and view feedback for