Note
Access to this page requires authorization. You can try signing in or changing directories.
Access to this page requires authorization. You can try changing directories.
Metrics are numerical measurements reported over time. Use them to monitor the health of an app and generate alerts. For example, a web service might track how many:
- Requests it receives per second.
- Milliseconds it takes to respond.
- Responses it sends with an error.
Report these metrics to a monitoring system at regular intervals. Set up dashboards to view metrics and create alerts to notify people of problems. If the web service is intended to respond to requests within 400 ms and starts responding in 600 ms, the monitoring system can notify the operations staff that the app response is slower than normal.
The comprehensive list of all instruments together with their attributes is described in ASP.NET Core built-in metrics.
Use metrics
Using metrics involves the following:
- Instrumentation: Code in .NET libraries takes measurements and associates these measurements with a metric name. .NET and ASP.NET Core include many built-in metrics.
- Collection and storage: A .NET app configures named metrics to be transmitted from the app for external storage and analysis. Some tools might perform configuration outside the app by using configuration files or a UI tool.
- Visualization: A tool that can display the metrics in a human-readable format. For example, Grafana and Prometheus.
- Alerting: A tool that provides notifications when a metric exceeds a threshold. For example, if the average response time for a web service exceeds 400 ms, an alert can be sent to the operations staff.
- Analysis: A tool that can analyze the metrics over time. This tool is often a web-based dashboard that can be customized to show the most important metrics for a specific app.
Instrumented code can record numeric measurements, but to create useful metrics for monitoring, you need to aggregate, transmit, and store the measurements. The process of aggregating, transmitting, and storing data is called collection. This tutorial shows several examples of collecting and displaying metrics:
- Populating metrics in Grafana with OpenTelemetry and Prometheus.
- Viewing metrics in real time with
dotnet-counters
You can also associate measurements with key-value pairs called tags that allow you to categorize data for analysis. For more information, see Multi-dimensional metrics.
Create the starter app
Create a new ASP.NET Core app with the following command:
dotnet new web -o WebMetric
cd WebMetric
dotnet add package OpenTelemetry.Exporter.Prometheus.AspNetCore --prerelease
dotnet add package OpenTelemetry.Extensions.Hosting
Replace the contents of Program.cs with the following code:
using OpenTelemetry.Metrics;

var builder = WebApplication.CreateBuilder(args);
builder.Services.AddOpenTelemetry()
    .WithMetrics(builder =>
    {
        builder.AddPrometheusExporter();

        builder.AddMeter("Microsoft.AspNetCore.Hosting",
                         "Microsoft.AspNetCore.Server.Kestrel");
        builder.AddView("http.server.request.duration",
            new ExplicitBucketHistogramConfiguration
            {
                Boundaries = new double[] { 0, 0.005, 0.01, 0.025, 0.05,
                       0.075, 0.1, 0.25, 0.5, 0.75, 1, 2.5, 5, 7.5, 10 }
            });
    });
var app = builder.Build();

app.MapPrometheusScrapingEndpoint();

app.MapGet("/", () => "Hello OpenTelemetry! ticks:"
                     + DateTime.Now.Ticks.ToString()[^3..]);

app.Run();
View metrics with dotnet-counters
dotnet-counters is a command-line tool that can view live metrics for .NET apps on demand. It doesn't require setup, making it useful for ad-hoc investigations or verifying that metric instrumentation is working. It works with both System.Diagnostics.Metrics based APIs and EventCounters.
If the dotnet-counters tool isn't installed, run the following command:
dotnet tool update -g dotnet-counters
While the test app is running, launch dotnet-counters. The following command shows an example of dotnet-counters monitoring all metrics from the Microsoft.AspNetCore.Hosting meter.
dotnet-counters monitor -n WebMetric --counters Microsoft.AspNetCore.Hosting
Output similar to the following is displayed:
Press p to pause, r to resume, q to quit.
    Status: Running

[Microsoft.AspNetCore.Hosting]
    http-server-current-requests
        host=localhost,method=GET,port=5045,scheme=http                    0
    http-server-request-duration (s)
        host=localhost,method=GET,port=5045,protocol=HTTP/1.1,ro           0.001
        host=localhost,method=GET,port=5045,protocol=HTTP/1.1,ro           0.001
        host=localhost,method=GET,port=5045,protocol=HTTP/1.1,ro           0.001
        host=localhost,method=GET,port=5045,protocol=HTTP/1.1,ro           0
        host=localhost,method=GET,port=5045,protocol=HTTP/1.1,ro           0
        host=localhost,method=GET,port=5045,protocol=HTTP/1.1,ro           0
For more information, see dotnet-counters.
Enrich the ASP.NET Core request metric
ASP.NET Core has many built-in metrics. The http.server.request.duration metric:
- Records the duration of HTTP requests on the server.
- Captures request information in tags, such as the matched route and response status code.
The http.server.request.duration metric supports tag enrichment by using IHttpMetricsTagsFeature. Enrichment is when a library or app adds its own tags to a metric. This feature is useful if an app wants to add a custom categorization to dashboards or alerts built with metrics.
using Microsoft.AspNetCore.Http.Features;

var builder = WebApplication.CreateBuilder();
var app = builder.Build();

app.Use(async (context, next) =>
{
    var tagsFeature = context.Features.Get<IHttpMetricsTagsFeature>();
    if (tagsFeature != null)
    {
        var source = context.Request.Query["utm_medium"].ToString() switch
        {
            "" => "none",
            "social" => "social",
            "email" => "email",
            "organic" => "organic",
            _ => "other"
        };
        tagsFeature.Tags.Add(new KeyValuePair<string, object?>("mkt_medium", source));
    }

    await next.Invoke();
});

app.MapGet("/", () => "Hello World!");

app.Run();
The preceding example:
- Adds middleware to enrich the ASP.NET Core request metric.
- Gets the IHttpMetricsTagsFeature from the
HttpContext. The feature is present on the context only if someone is listening to the metric. VerifyIHttpMetricsTagsFeatureisn'tnullbefore using it. - Adds a custom tag containing the request's marketing source to the
http.server.request.durationmetric.- The tag has the name
mkt_mediumand a value based on the utm_medium query string value. Theutm_mediumvalue is resolved to a known range of values. - The tag allows requests to be categorized by marketing medium type, which could be useful when analyzing web app traffic.
- The tag has the name
Note
Follow the multi-dimensional metrics best practices when enriching with custom tags. Tags that are too numerous or have an unbound range create many tag combinations, resulting in high dimensions. Collection tools have limits on supported dimensions for a counter and might filter results to prevent excessive memory use.
Opt out of HTTP metrics on certain endpoints and requests
Opting out of recording metrics is beneficial for endpoints frequently called by automated systems, such as health checks. Recording metrics for these requests is generally unnecessary. Unwanted telemetry uses resources to collect and store, and can distort results displayed in a telemetry dashboard.
You can exclude HTTP requests to an endpoint from metrics by adding metadata, with either the DisableHttpMetrics attribute or the DisableHttpMetrics method:
- Add the DisableHttpMetrics attribute to the Web API controller, SignalR hub, or gRPC service.
- Call DisableHttpMetrics when mapping endpoints in app startup:
var builder = WebApplication.CreateBuilder(args);
builder.Services.AddHealthChecks();

var app = builder.Build();
app.MapHealthChecks("/healthz").DisableHttpMetrics();
app.Run();
Alternatively, the IHttpMetricsTagsFeature.MetricsDisabled property was added for:
- Advanced scenarios where a request doesn't map to an endpoint.
- Dynamically disabling metrics collection for specific HTTP requests.
// Middleware that conditionally opts-out HTTP requests.
app.Use(async (context, next) =>
{
    var metricsFeature = context.Features.Get<IHttpMetricsTagsFeature>();
    if (metricsFeature != null &&
        context.Request.Headers.ContainsKey("x-disable-metrics"))
    {
        metricsFeature.MetricsDisabled = true;
    }

    await next(context);
});
Create custom metrics
You create metrics by using APIs in the System.Diagnostics.Metrics namespace. For information, see Create custom metrics.
Creating metrics in ASP.NET Core apps with IMeterFactory
Create Meter instances in ASP.NET Core apps with IMeterFactory.
ASP.NET Core registers IMeterFactory in dependency injection (DI) by default. The meter factory integrates metrics with DI, making isolating and collecting metrics easy. IMeterFactory is especially useful for testing. It allows for multiple tests to run side-by-side and only collects metrics values that are recorded in a test.
To use IMeterFactory in an app, create a type that uses IMeterFactory to create the app's custom metrics:
public class ContosoMetrics
{
    private readonly Counter<int> _productSoldCounter;

    public ContosoMetrics(IMeterFactory meterFactory)
    {
        var meter = meterFactory.Create("Contoso.Web");
        _productSoldCounter = meter.CreateCounter<int>("contoso.product.sold");
    }

    public void ProductSold(string productName, int quantity)
    {
        _productSoldCounter.Add(quantity,
            new KeyValuePair<string, object?>("contoso.product.name", productName));
    }
}
Register the metrics type with DI in Program.cs:
var builder = WebApplication.CreateBuilder(args);
builder.Services.AddSingleton<ContosoMetrics>();
Inject the metrics type and record values where needed. Because the metrics type is registered in DI it can be used with MVC controllers, Minimal APIs, or any other type that is created by DI:
app.MapPost("/complete-sale", (SaleModel model, ContosoMetrics metrics) =>
{
    // ... business logic such as saving the sale to a database ...

    metrics.ProductSold(model.ProductName, model.QuantitySold);
});
To monitor the "Contoso.Web" meter, use the following dotnet-counters command.
dotnet-counters monitor -n WebMetric --counters Contoso.Web
Output similar to the following is displayed:
Press p to pause, r to resume, q to quit.
    Status: Running

[Contoso.Web]
    contoso.product.sold (Count / 1 sec)
        contoso.product.name=Eggs            12
        contoso.product.name=Milk            0
View metrics in Grafana with OpenTelemetry and Prometheus
Overview
- Is a vendor-neutral open-source project supported by the Cloud Native Computing Foundation.
- Standardizes generating and collecting telemetry for cloud-native software.
- Works with .NET using the .NET metric APIs.
- Is endorsed by Azure Monitor and many APM vendors.
Starting in ASP.NET Core 11, the framework's built-in HTTP server metrics and traces comply with the required parts of the OpenTelemetry HTTP server semantic conventions. The HTTP server request activity emits these attributes by default, matching the built-in metrics. As a result, the OpenTelemetry.Instrumentation.AspNetCore NuGet package is optional for collecting HTTP server metrics and traces. The sample in this article uses only the built-in meters (Microsoft.AspNetCore.Hosting and Microsoft.AspNetCore.Server.Kestrel) and doesn't reference the instrumentation package. For the list of built-in instruments and their attributes, see ASP.NET Core built-in HTTP metrics.
Although the package is optional, it isn't a drop-in equivalent of the built-in instrumentation. The built-in instrumentation covers only the required parts of the semantic conventions. Consider the following differences before you remove the package:
- Some recommended HTTP server attributes aren't emitted by the built-in instrumentation, such as certain client and network attributes (for example,
client.address). Full support for the conditionally requiredurl.queryattribute, including redaction, is also still in progress. If you rely on these attributes, keep the package. For more information, see dotnet/aspnetcore#65873. - The package is also a convenience for enabling telemetry beyond the HTTP server, including Blazor and SignalR. For tracing, it registers extra activity sources for SignalR (
Microsoft.AspNetCore.SignalR.Serveron .NET 9 and later) and Blazor (Microsoft.AspNetCore.ComponentsandMicrosoft.AspNetCore.Components.Server.Circuitson .NET 10 and later). For metrics, it enables the related built-in meters (such asMicrosoft.AspNetCore.Components). Without the package, register the sources withAddSourceand the meters withAddMeteryourself to collect the same telemetry.
When you add telemetry to an app that only needs HTTP server metrics and traces, you can rely on the built-in instrumentation and omit the package. When you upgrade an existing app from .NET 10 to .NET 11 that already references the package, keep it if you depend on the attributes, sources, or meters described in the preceding list. Removing the package silently drops that telemetry.
Important
When you enable OpenTelemetry tracing (in addition to metrics) without the OpenTelemetry.Instrumentation.AspNetCore package, register the framework's HTTP server ActivitySource so that the request activity is recorded. ASP.NET Core's HTTP server activity source is named Microsoft.AspNetCore, and the framework creates a request activity named Microsoft.AspNetCore.Hosting.HttpRequestIn for each request to propagate trace context. If the Microsoft.AspNetCore source isn't registered with the OpenTelemetry SDK, the request activity isn't recorded, and the default ParentBased sampler silently drops any custom child spans started during the request.
In your existing tracing pipeline, register the source explicitly:
builder.Services.AddOpenTelemetry()
    .WithTracing(tracing => tracing
        .AddSource("Microsoft.AspNetCore")
        .AddSource("MyApp"));
In the preceding example:
AddSource("Microsoft.AspNetCore")registers ASP.NET Core's HTTP server activity source so the request activity is recorded.AddSource("MyApp")registers the app's own ActivitySource. ReplaceMyAppwith the name your app uses.- An exporter isn't shown. This example assumes an exporter is already configured in your tracing pipeline.
Alternatively, call AddAspNetCoreInstrumentation() from the OpenTelemetry.Instrumentation.AspNetCore package, which registers the source for you.
This tutorial shows one of the integrations available for OpenTelemetry metrics using the OSS Prometheus and Grafana projects. The metrics data flow:
The ASP.NET Core metric APIs record measurements from the example app.
The OpenTelemetry .NET library running in the app aggregates the measurements.
The Prometheus exporter library makes the aggregated data available via an HTTP metrics endpoint. 'Exporter' is what OpenTelemetry calls the libraries that transmit telemetry to vendor-specific backends.
A Prometheus server:
- Polls the metrics endpoint.
- Reads the data.
- Stores the data in a database for long-term persistence. Prometheus refers to reading and storing data as scraping an endpoint.
- Can run on a different machine.
The Grafana server:
- Queries the data stored in Prometheus and displays it on a web-based monitoring dashboard.
- Can run on a different machine.
View metrics from sample app
Go to the sample app. The browser shows Hello OpenTelemetry! ticks:<3digits> where 3digits are the last three digits of the current DateTime.Ticks.
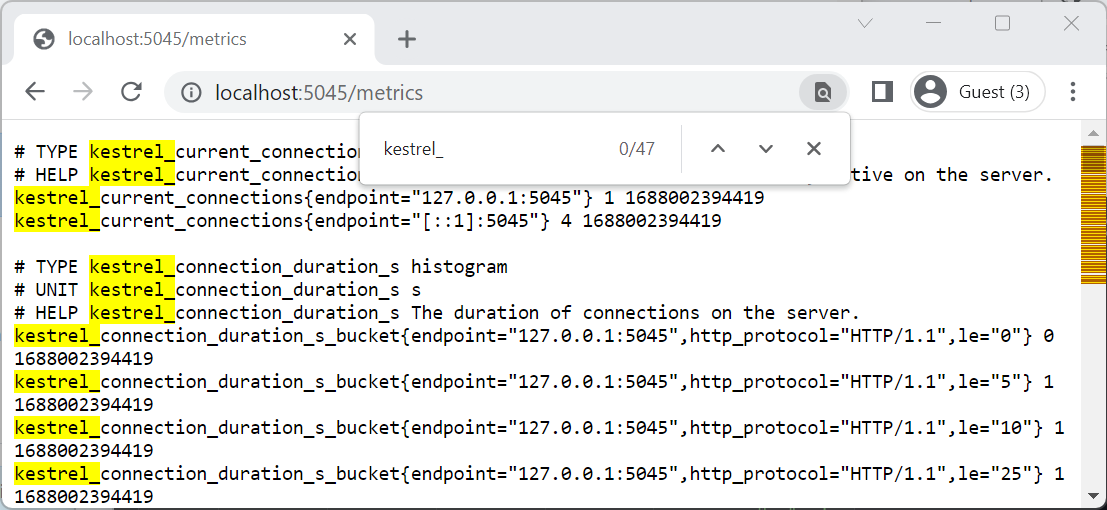
Append /metrics to the URL to view the metrics endpoint. The browser displays the metrics being collected:
Set up and configure Prometheus
Follow the Prometheus first steps to set up a Prometheus server and confirm it's working.
Modify the prometheus.yml configuration file so that Prometheus scrapes the metrics endpoint that the example app exposes. Add the following highlighted text in the scrape_configs section:
# my global config
global:
  scrape_interval: 15s # Set the scrape interval to every 15 seconds. Default is every 1 minute.
  evaluation_interval: 15s # Evaluate rules every 15 seconds. The default is every 1 minute.
  # scrape_timeout is set to the global default (10s).

# Alertmanager configuration
alerting:
  alertmanagers:
    - static_configs:
        - targets:
          # - alertmanager:9093

# Load rules once and periodically evaluate them according to the global 'evaluation_interval'.
rule_files:
  # - "first_rules.yml"
  # - "second_rules.yml"

# A scrape configuration containing exactly one endpoint to scrape:
# Here it's Prometheus itself.
scrape_configs:
  # The job name is added as a label `job=<job_name>` to any timeseries scraped from this config.
  - job_name: "prometheus"

    # metrics_path defaults to '/metrics'
    # scheme defaults to 'http'.

    static_configs:
      - targets: ["localhost:9090"]

  - job_name: 'MyASPNETApp'
    scrape_interval: 5s # Poll every 5 seconds for a more responsive demo.
    static_configs:
      - targets: ["localhost:5045"]  ## Enter the HTTP port number of the demo app.
In the preceding highlighted YAML, replace 5045 with the port number that the example app uses.
Start Prometheus
- Reload the configuration or restart the Prometheus server.
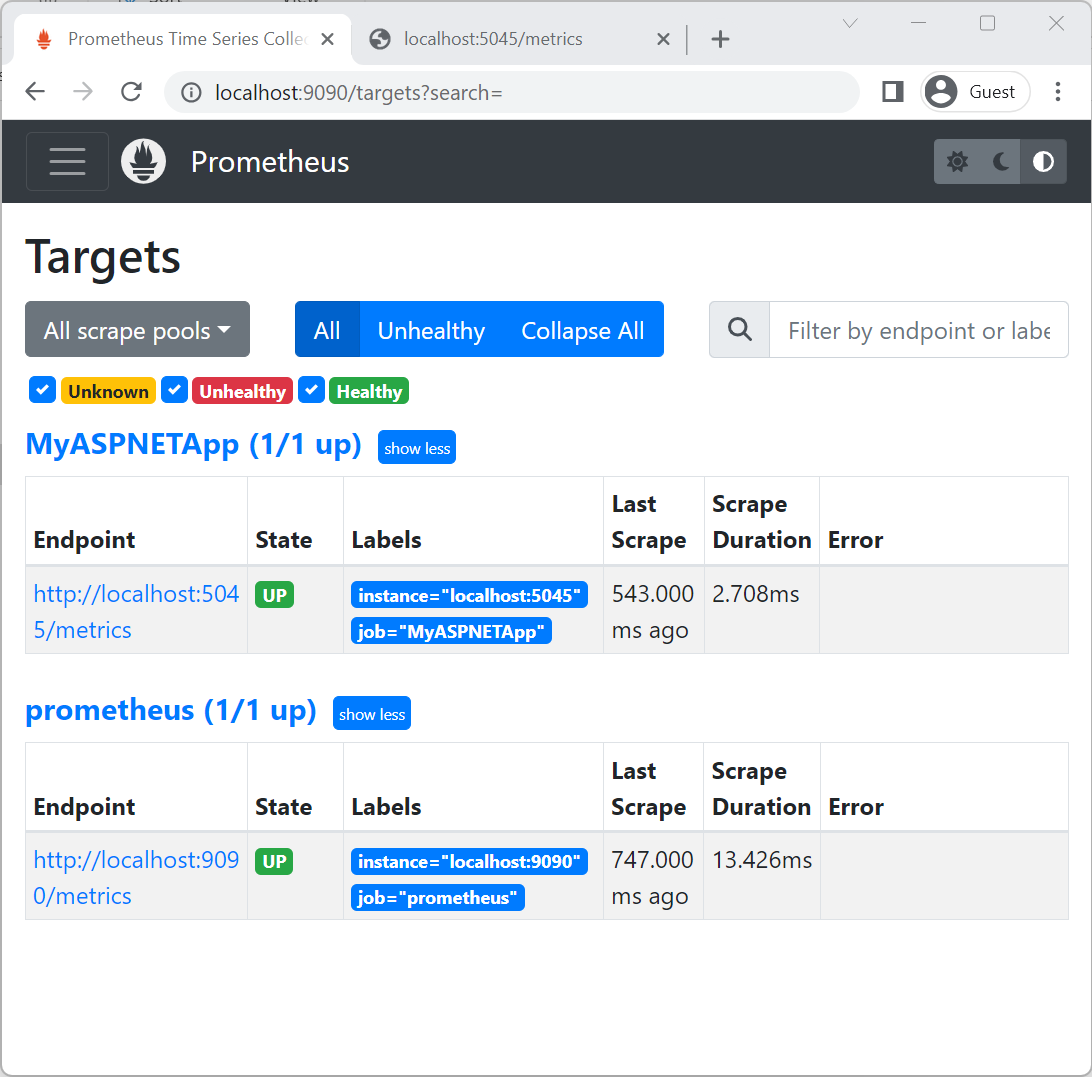
- Confirm that OpenTelemetryTest is in the UP state in the Status > Targets page of the Prometheus web portal.
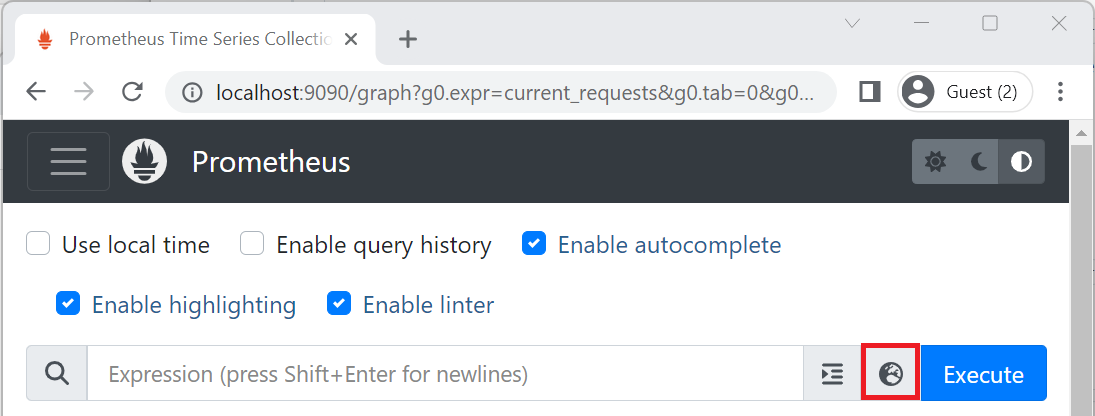
Select the Open metric explorer icon to see available metrics:
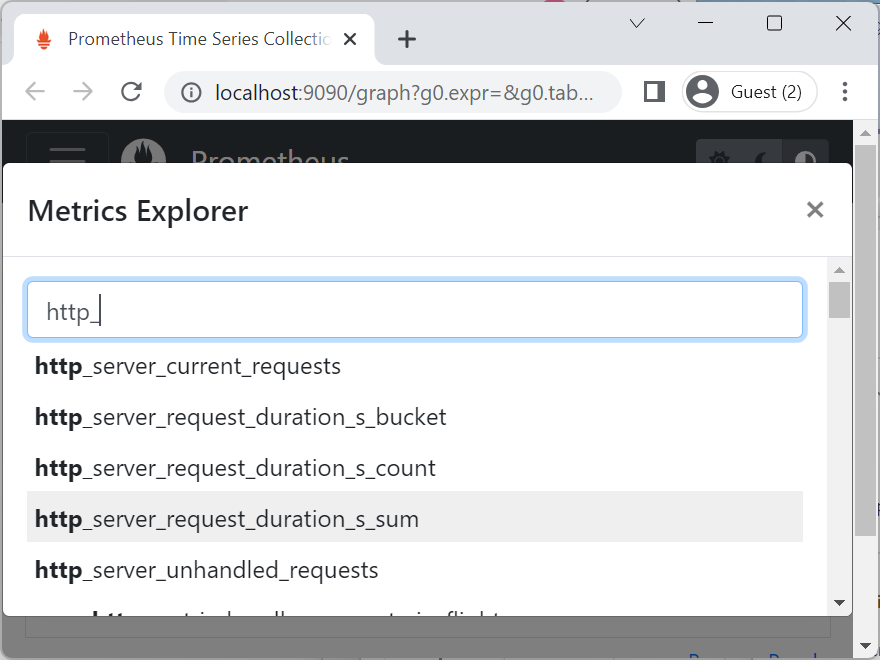
Enter a counter category such as http_ in the Expression input box to see the available metrics:
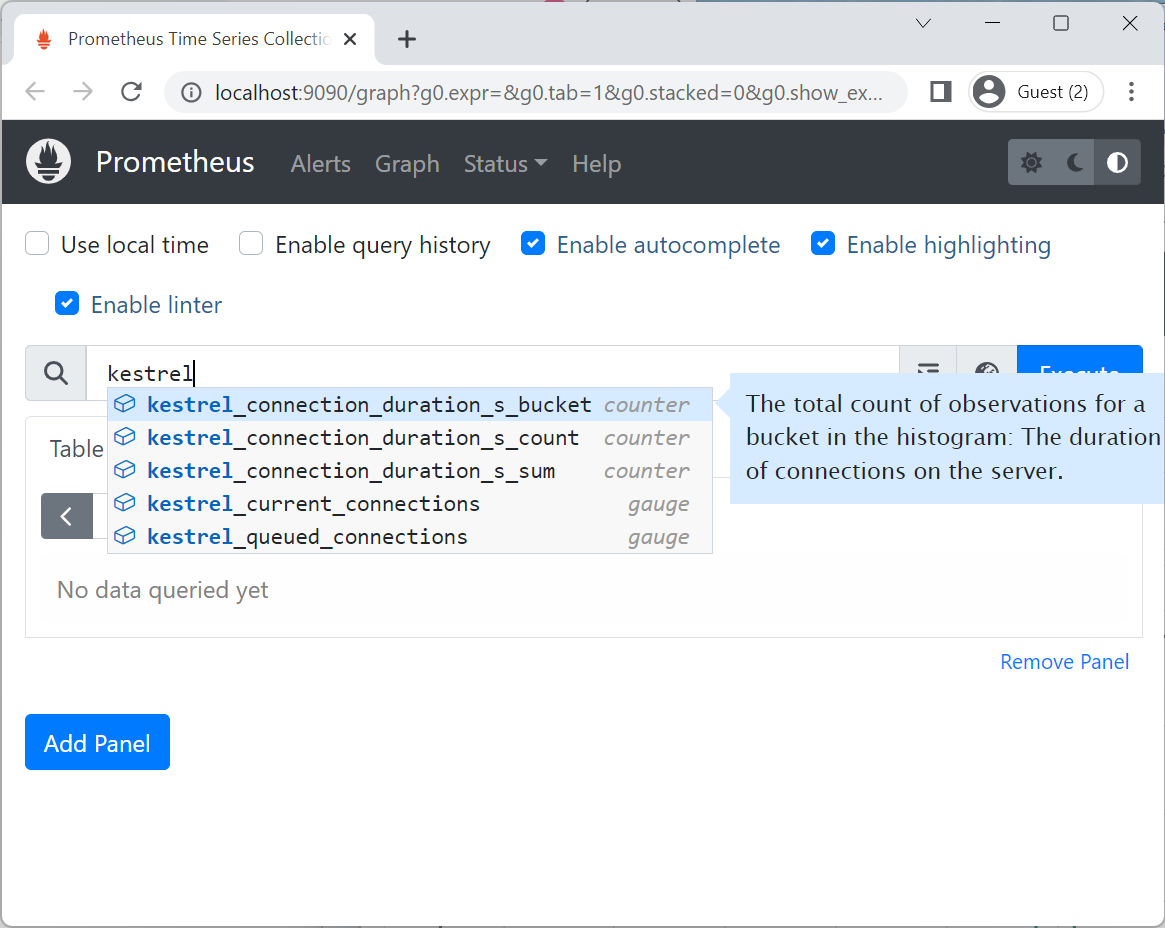
Alternatively, enter a counter category such as kestrel in the Expression input box to see the available metrics:
Show metrics on a Grafana dashboard
Follow the installation instructions to install Grafana and connect it to a Prometheus data source.
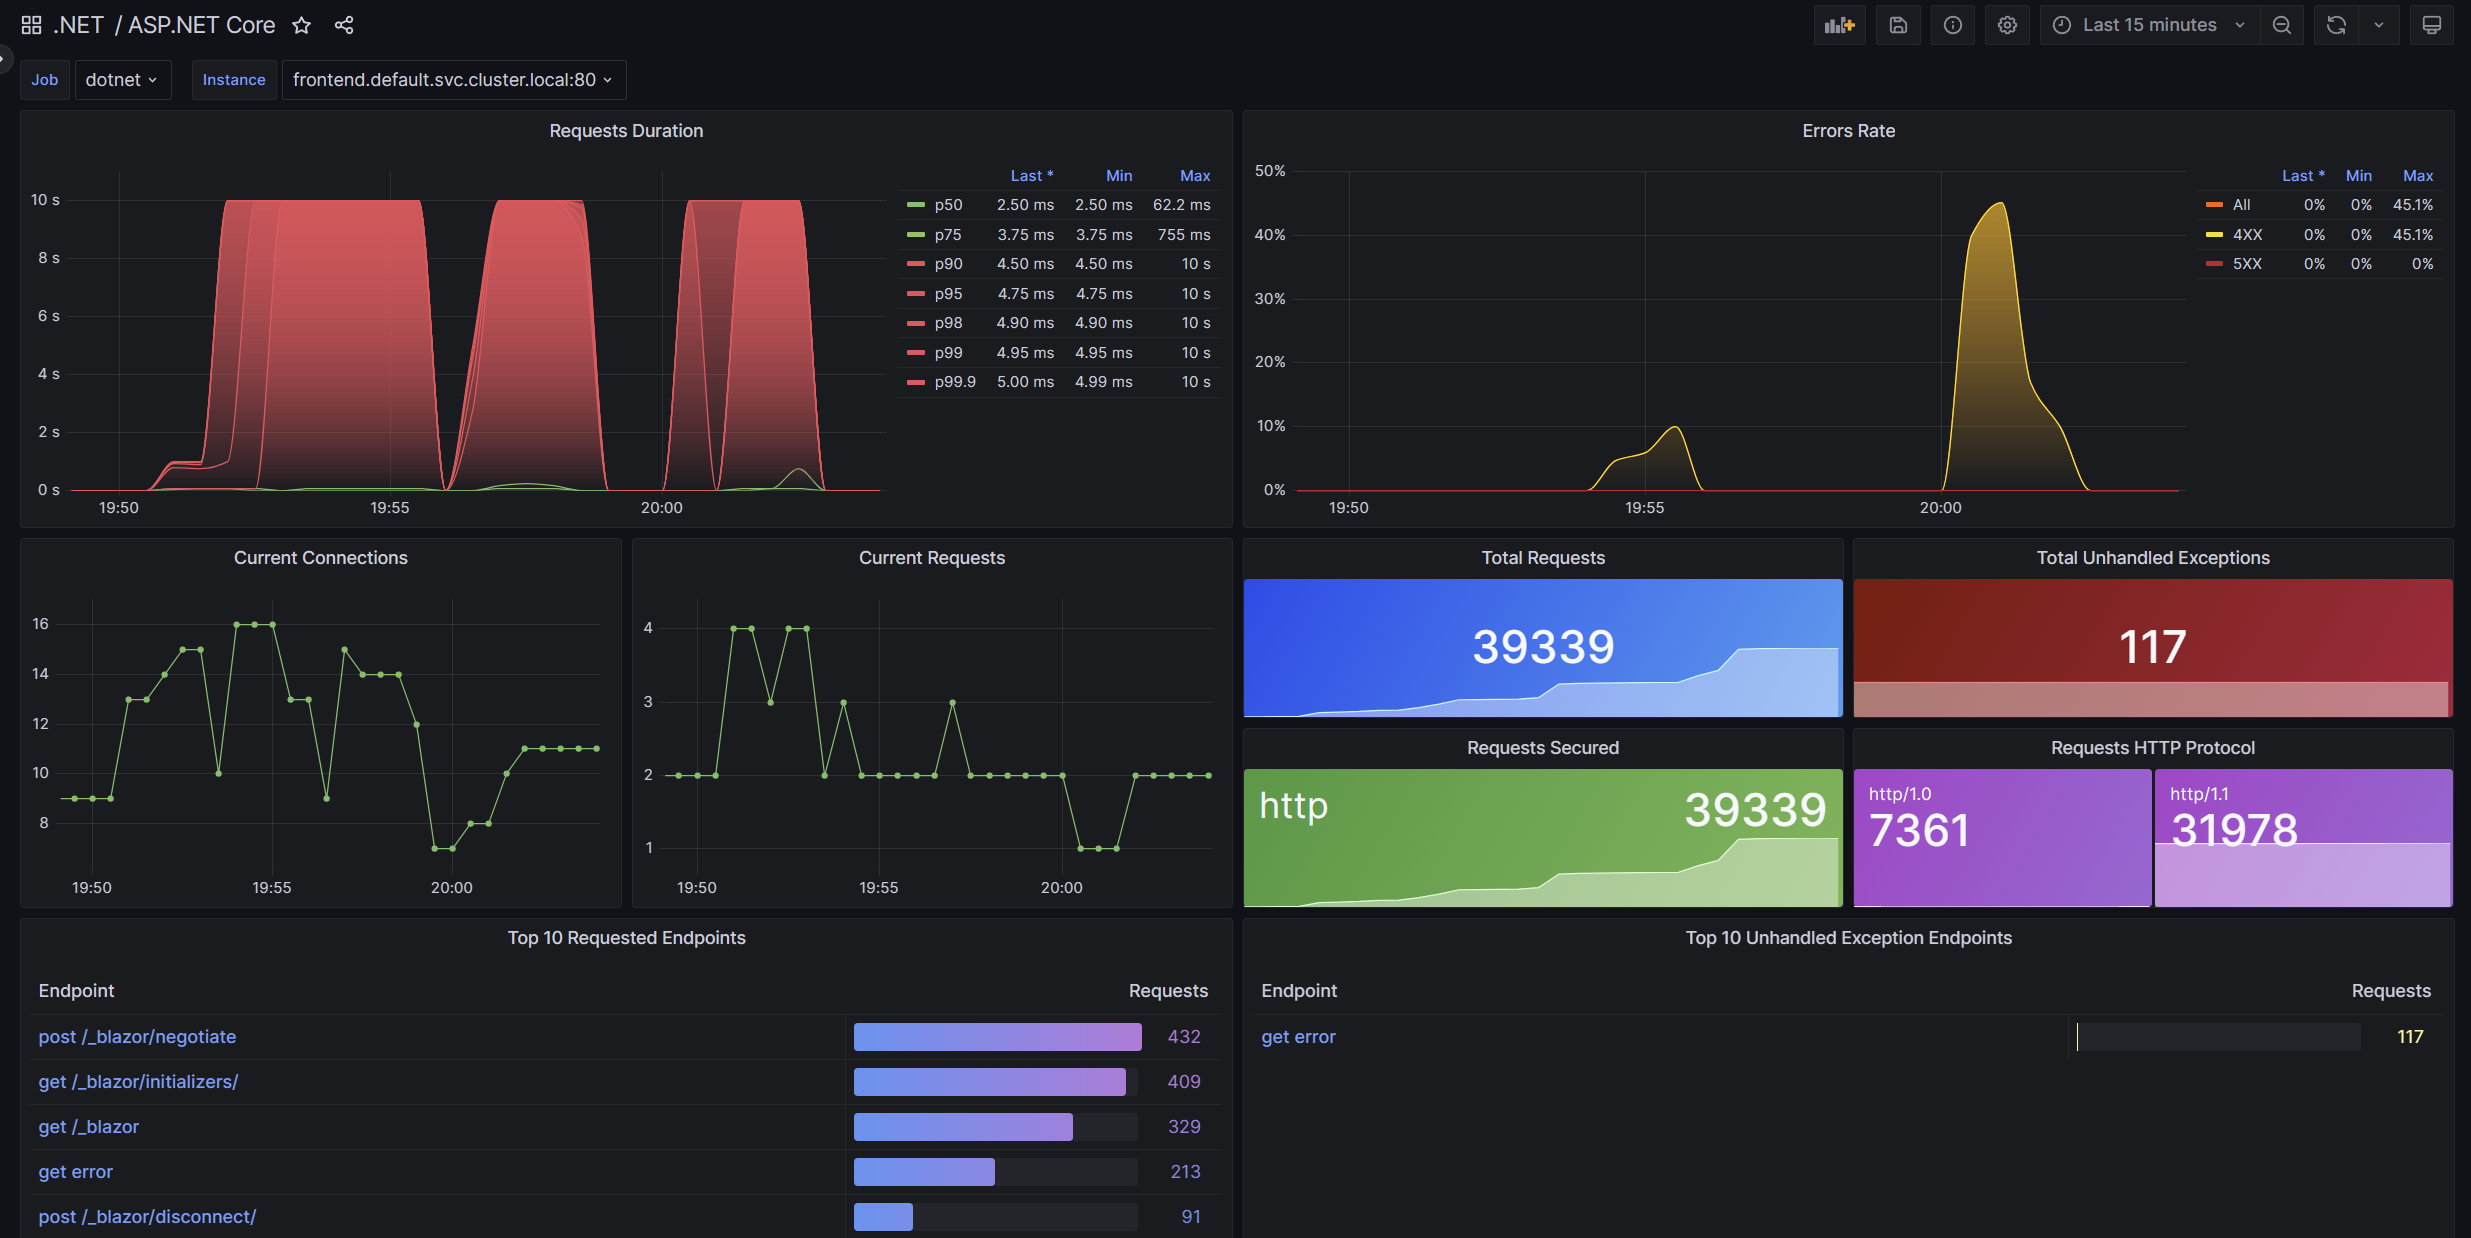
Follow Creating a Prometheus graph. Alternatively, pre-built dashboards for .NET metrics are available to download at .NET team dashboards @ grafana.com. Downloaded dashboard JSON can be imported into Grafana.
Test metrics in ASP.NET Core apps
You can test metrics in ASP.NET Core apps. One way to do this is to collect and assert metrics values in ASP.NET Core integration tests by using MetricCollector<T>.
public class BasicTests : IClassFixture<WebApplicationFactory<Program>>
{
    private readonly WebApplicationFactory<Program> _factory;
    public BasicTests(WebApplicationFactory<Program> factory) => _factory = factory;

    [Fact]
    public async Task Get_RequestCounterIncreased()
    {
        // Arrange
        var client = _factory.CreateClient();
        var meterFactory = _factory.Services.GetRequiredService<IMeterFactory>();
        var collector = new MetricCollector<double>(meterFactory,
            "Microsoft.AspNetCore.Hosting", "http.server.request.duration");

        // Act
        var response = await client.GetAsync("/");

        // Assert
        Assert.Contains("Hello OpenTelemetry!", await response.Content.ReadAsStringAsync());

        await collector.WaitForMeasurementsAsync(minCount: 1).WaitAsync(TimeSpan.FromSeconds(5));
        Assert.Collection(collector.GetMeasurementSnapshot(),
            measurement =>
            {
                Assert.Equal("http", measurement.Tags["url.scheme"]);
                Assert.Equal("GET", measurement.Tags["http.request.method"]);
                Assert.Equal("/", measurement.Tags["http.route"]);
            });
    }
}
The preceding test:
- Bootstraps a web app in memory with WebApplicationFactory<TEntryPoint>.
Programin the factory's generic argument specifies the web app. - Collects metrics values with MetricCollector<T>
- Requires a package reference to
Microsoft.Extensions.Diagnostics.Testing. - The
MetricCollector<T>is created using the web app's IMeterFactory. This allows the collector to only report metrics values recorded by test. - Includes the meter name,
Microsoft.AspNetCore.Hosting, and counter name,http.server.request.durationto collect.
- Requires a package reference to
- Makes an HTTP request to the web app.
- Asserts the test by using results from the metrics collector.
ASP.NET Core Identity metrics
ASP.NET Core Identity observability helps you monitor user management activities and authentication processes.
The metrics are in the Microsoft.AspNetCore.Identity meter and are described in the following sections.
User management metrics
aspnetcore.identity.user.create.durationmeasures the duration of user creation operations.aspnetcore.identity.user.update.durationmeasures the duration of user update operations.aspnetcore.identity.user.delete.durationmeasures the duration of user deletion operations.aspnetcore.identity.user.check_password_attemptscounts password verification attempts.aspnetcore.identity.user.generated_tokenscounts tokens generated for users, such as password reset tokens.aspnetcore.identity.user.verify_token_attemptscounts token verification attempts.
Authentication metrics
aspnetcore.identity.sign_in.authenticate.durationmeasures the duration of authentication operations.aspnetcore.identity.sign_in.check_password_attemptscounts password check attempts during sign-in.aspnetcore.identity.sign_in.sign_inscounts successful sign-ins.aspnetcore.identity.sign_in.sign_outscounts sign-outs.aspnetcore.identity.sign_in.two_factor_clients_rememberedcounts remembered two-factor clients.aspnetcore.identity.sign_in.two_factor_clients_forgottencounts forgotten two-factor clients.
Use these metrics to:
- Monitor user registration and management.
- Track authentication patterns and potential security issues.
- Measure performance of Identity operations.
- Observe two-factor authentication usage.
Viewing Identity metrics
Use dotnet-counters to view these metrics and monitor them in real-time. Or, export them to Prometheus and visualize them in Grafana by using the techniques described earlier in this article.
For example, to monitor all Identity metrics with dotnet-counters:
dotnet-counters monitor -n YourAppName --counters Microsoft.AspNetCore.Identity
ASP.NET Core meters and counters
For a list of ASP.NET Core meters and counters, see ASP.NET Core metrics. In ASP.NET Core 11 and later, the built-in HTTP server meters (for example, Microsoft.AspNetCore.Hosting and Microsoft.AspNetCore.Server.Kestrel) emit data that conforms to the required parts of the OpenTelemetry HTTP server semantic conventions. You can consume these meters with the OpenTelemetry SDK without the OpenTelemetry.Instrumentation.AspNetCore package.
Collaborate with us on GitHub
The source for this content can be found on GitHub, where you can also create and review issues and pull requests. For more information, see our contributor guide.

ASP.NET Core