Note
Access to this page requires authorization. You can try signing in or changing directories.
Access to this page requires authorization. You can try changing directories.
This article provides guidance for gathering diagnostics from your ASP.NET Core SignalR app to help troubleshoot issues.
Server-side logging
Warning
Server-side logs may contain sensitive information from your app. Never post raw logs from production apps to public forums like GitHub.
Since SignalR is part of ASP.NET Core, it uses the ASP.NET Core logging system. In the default configuration, SignalR logs minimal information, but the logging level can be configured. See the documentation on ASP.NET Core logging for details on configuring ASP.NET Core logging.
SignalR uses two logger categories:
Microsoft.AspNetCore.SignalR: For logs related to Hub Protocols, activating Hubs, invoking methods, and other Hub-related activities.Microsoft.AspNetCore.Http.Connections: For logs related to transports, such as WebSockets, Long Polling, Server-Sent Events, and low-level SignalR infrastructure.
To enable detailed logs from SignalR, configure both of the preceding prefixes to the Debug level in your appsettings.json file by adding the following items to the LogLevel subsection in Logging:
{
    "Logging": {
        "LogLevel": {
            "Default": "Debug",
            "System": "Information",
            "Microsoft": "Information",
            "Microsoft.AspNetCore.SignalR": "Debug",
            "Microsoft.AspNetCore.Http.Connections": "Debug"
        }
    }
}
The logging levels for the SignalR logger categories can also be configured in code within the CreateWebHostBuilder method:
public static IWebHostBuilder CreateWebHostBuilder(string[] args) =>
    WebHost.CreateDefaultBuilder(args)
        .ConfigureLogging(logging =>
        {
            logging.AddFilter("Microsoft.AspNetCore.SignalR", LogLevel.Debug);
            logging.AddFilter("Microsoft.AspNetCore.Http.Connections", LogLevel.Debug);
        })
        .UseStartup<Startup>();
If you aren't using JSON-based configuration, set the following configuration values in your configuration system:
Logging:LogLevel:Microsoft.AspNetCore.SignalR=DebugLogging:LogLevel:Microsoft.AspNetCore.Http.Connections=Debug
Check the documentation for your configuration system to determine how to specify nested configuration values. For example, when using environment variables, two _ characters are used instead of the : (for example, Logging__LogLevel__Microsoft.AspNetCore.SignalR).
We recommend using the Debug level when gathering more detailed diagnostics for your app. The Trace level produces low-level diagnostics and is rarely needed to diagnose issues in your app.
Access server-side logs
How server-side logs are accessed depends on the environment in which the app is running.
As a console app outside IIS
If you're running in a console app, the Console logger should be enabled by default. SignalR logs appear in the console.
Within IIS Express from Visual Studio
Visual Studio displays the log output in the Output window. Select the ASP.NET Core Web Server drop down option.
Azure App Service
Enable the Application Logging (Filesystem) option in the Diagnostics logs section of the Azure App Service portal and configure the Level to Verbose. Logs should be available from the Log streaming service and in logs on the file system of the App Service. For more information, see Azure log streaming.
Other environments
For more information on configuring logging providers suitable for different deployment environments, such as Docker, Kubernetes, or Windows Service, see Logging in .NET Core and ASP.NET Core.
JavaScript client logging
Warning
Client-side logs may contain sensitive information from your app. Never post raw logs from production apps to public forums like GitHub.
When using the JavaScript client, you can configure logging options using the configureLogging method on HubConnectionBuilder:
let connection = new signalR.HubConnectionBuilder()
    .withUrl("/my/hub/url")
    .configureLogging(signalR.LogLevel.Debug)
    .build();
Disable framework logging by specifying signalR.LogLevel.None in the configureLogging method. Note that some logging is emitted directly by the browser and can't be disabled via setting the log level.
The following table shows log levels available to the JavaScript client. Setting the log level to one of these values enables logging at that level and all levels above it in the table.
| Level | Description |
|---|---|
None |
No messages are logged. |
Critical |
Messages that indicate a failure in the entire app. |
Error |
Messages that indicate a failure in the current operation. |
Warning |
Messages that indicate a non-fatal problem. |
Information |
Informational messages. |
Debug |
Diagnostic messages useful for debugging. |
Trace |
Very detailed diagnostic messages designed for diagnosing specific issues. |
Once you've configured the verbosity, the logs will be written to the Browser Console (or Standard Output in a NodeJS app).
If you want to send logs to a custom logging system, you can provide a JavaScript object implementing the ILogger interface. The only method that needs to be implemented is log, which takes the level of the event and the message associated with the event. For example:
import { ILogger, LogLevel, HubConnectionBuilder } from "@microsoft/signalr";

export class MyLogger implements ILogger {
    log(logLevel: LogLevel, message: string) {
        // Use `message` and `logLevel` to record the log message to your own system
    }
}

// later on, when configuring your connection...

let connection = new HubConnectionBuilder()
    .withUrl("/my/hub/url")
    .configureLogging(new MyLogger())
    .build();
import { ILogger, LogLevel, HubConnectionBuilder } from "@aspnet/signalr";

export class MyLogger implements ILogger {
    log(logLevel: LogLevel, message: string) {
        // Use `message` and `logLevel` to record the log message to your own system
    }
}

// later on, when configuring your connection...

let connection = new HubConnectionBuilder()
    .withUrl("/my/hub/url")
    .configureLogging(new MyLogger())
    .build();
.NET client logging
Warning
Client-side logs may contain sensitive information from your app. Never post raw logs from production apps to public forums like GitHub.
To get logs from the .NET client, you can use the ConfigureLogging method on HubConnectionBuilder. This works the same way as the ConfigureLogging method on WebHostBuilder and HostBuilder. You can configure the same logging providers you use in ASP.NET Core. However, you have to manually install and enable the NuGet packages for the individual logging providers.
To add .NET client logging to a Blazor WebAssembly app, see ASP.NET Core Blazor logging.
Console logging
In order to enable Console logging, add the Microsoft.Extensions.Logging.Console package. Then, use the AddConsole method to configure the console logger:
var connection = new HubConnectionBuilder()
    .WithUrl("https://example.com/my/hub/url")
    .ConfigureLogging(logging =>
    {
        // Log to the Console
        logging.AddConsole();

        // This will set ALL logging to Debug level
        logging.SetMinimumLevel(LogLevel.Debug);
    })
    .Build();
Debug output window logging
Logs can be configured to go to the Output window in Visual Studio. Install the Microsoft.Extensions.Logging.Debug package and use the AddDebug method:
var connection = new HubConnectionBuilder()
    .WithUrl("https://example.com/my/hub/url")
    .ConfigureLogging(logging =>
    {
        // Log to the Output Window
        logging.AddDebug();

        // This will set ALL logging to Debug level
        logging.SetMinimumLevel(LogLevel.Debug)
    })
    .Build();
Other logging providers
SignalR supports other logging providers such as Serilog, Seq, NLog, or any other logging system that integrates with Microsoft.Extensions.Logging. If your logging system provides an ILoggerProvider, you can register it with AddProvider:
var connection = new HubConnectionBuilder()
    .WithUrl("https://example.com/my/hub/url")
    .ConfigureLogging(logging =>
    {
        // Log to your custom provider
        logging.AddProvider(new MyCustomLoggingProvider());

        // This will set ALL logging to Debug level
        logging.SetMinimumLevel(LogLevel.Debug)
    })
    .Build();
Control verbosity
When logging from other places in the app, changing the default level to Debug may be too verbose. A Filter can be used to configure the logging level for SignalR logs. This can be done in code, in much the same way as on the server:
var connection = new HubConnectionBuilder()
    .WithUrl("https://example.com/my/hub/url")
    .ConfigureLogging(logging =>
    {
        // Register your providers

        // Set the default log level to Information, but to Debug for SignalR-related loggers.
        logging.SetMinimumLevel(LogLevel.Information);
        logging.AddFilter("Microsoft.AspNetCore.SignalR", LogLevel.Debug);
        logging.AddFilter("Microsoft.AspNetCore.Http.Connections", LogLevel.Debug);
    })
    .Build();
Tracing in SignalR
SignalR hub server and the SignalR client provide information about SignalR connections and messages using DiagnosticSource and Activity. SignalR has an ActivitySource for both the hub server and client, avaialble starting with .NET 9.
An ActivitySource is a component used in distributed tracing to create and manage activities (or spans) that represent operations in your application. These activities can be used to:
- Track the flow of requests and operations across different components and services.
- Provide valuable insights into the performance and behavior of your application.
.NET SignalR server ActivitySource
The SignalR ActivitySource named Microsoft.AspNetCore.SignalR.Server emits events for hub method calls:
- Every method is its own activity, so anything that emits an activity during the hub method call is under the hub method activity.
- Hub method activities don't have a parent. This means they aren't bundled under the long-running SignalR connection.
The following example uses the .NET Aspire dashboard and the OpenTelemetry packages:
<PackageReference Include="OpenTelemetry.Exporter.OpenTelemetryProtocol" Version="1.9.0" />
<PackageReference Include="OpenTelemetry.Extensions.Hosting" Version="1.9.0" />
<PackageReference Include="OpenTelemetry.Instrumentation.AspNetCore" Version="1.9.0" />
Add the following startup code to the Program.cs file:
using OpenTelemetry.Trace;
using SignalRChat.Hubs;

// Set OTEL_EXPORTER_OTLP_ENDPOINT environment variable depending on where your OTEL endpoint is.
var builder = WebApplication.CreateBuilder(args);

builder.Services.AddRazorPages();
builder.Services.AddSignalR();

builder.Services.AddOpenTelemetry()
    .WithTracing(tracing =>
    {
        if (builder.Environment.IsDevelopment())
        {
            // View all traces only in development environment.
            tracing.SetSampler(new AlwaysOnSampler());
        }

        tracing.AddAspNetCoreInstrumentation();
        tracing.AddSource("Microsoft.AspNetCore.SignalR.Server");
    });

builder.Services.ConfigureOpenTelemetryTracerProvider(tracing => tracing.AddOtlpExporter());

var app = builder.Build();
The following example output is from the Aspire Dashboard:

ASP.NET Core also provides its own metrics on Microsoft.AspNetCore.Hosting event source.
.NET SignalR client ActivitySource
The SignalR ActivitySource named Microsoft.AspNetCore.SignalR.Client emits events for a SignalR client:
- Hub invocations create a client span. Other SignalR clients, such as the JavaScript client, don't support tracing. This feature will be added to more clients in future releases.
- Hub invocations on the client and server support context propagation. Propagating the trace context enables true distributed tracing. It's now possible to see invocations flow from the client to the server and back.
Here's how these new activities look in the .NET Aspire dashboard:

Network traces
Warning
A network trace contains the full contents of every message sent by your app. Never post raw network traces from production apps to public forums like GitHub.
If you encounter an issue, a network trace can sometimes provide a valuable information. This is especially helpful when filing an issue on our issue tracker.
Collect a network trace with Fiddler (preferred option)
This method works for all apps.
Fiddler is a powerful tool for collecting HTTP traces. Install it from telerik.com/fiddler, launch it, and then run your app and reproduce the issue. Fiddler is available for Windows, and there are beta versions for macOS and Linux.
If you connect using HTTPS, there are some extra steps to ensure Fiddler can decrypt the HTTPS traffic. For more information, see the Fiddler documentation.
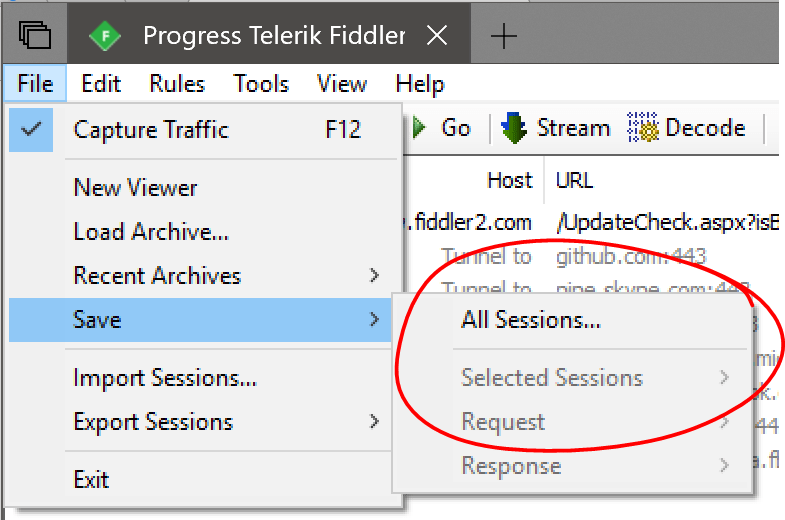
After collecting the trace, export it by selecting File > Save > All Sessions from the menu bar
Collect a network trace with tcpdump (macOS and Linux only)
This method works for all apps.
Raw TCP traces can be collected using tcpdump by running the following command from a command shell. You may need to be root or prefix the command with sudo if you get a permissions error:
tcpdump -i [interface] -w trace.pcap
Replace [interface] with the network interface you wish to capture on. Usually, this is something like /dev/eth0 (for a standard Ethernet interface) or /dev/lo0 (for localhost traffic). For more information, see the tcpdump manual page on your host system.
Collect a network trace in the browser
This method only works for browser-based apps.
Most browser developer tools consoles have a "Network" tab that allows network activity to be captured between the browser and the server. However, these traces don't include WebSocket and Server-Sent Event messages. When using those transports, using a tool like Fiddler or TcpDump is a better approach, as described later in this article.
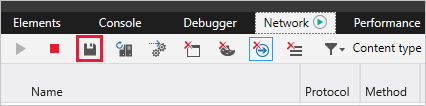
Microsoft Edge and Internet Explorer
(The instructions are the same for both Microsoft Edge and Internet Explorer)
- Open the Dev Tools by pressing F12
- Select the Network Tab
- Refresh the page (if needed) and reproduce the problem
- Select the Save icon in the toolbar to export the trace as a "HAR" file:
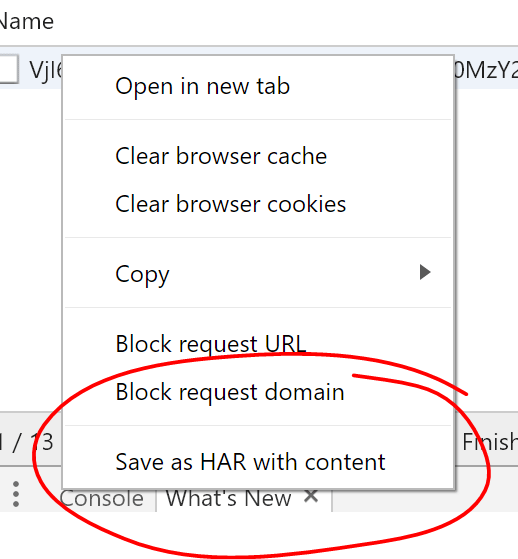
Google Chrome
- Open the Dev Tools by pressing F12
- Select the Network Tab
- Refresh the page (if needed) and reproduce the problem
- Right click anywhere in the list of requests and choose "Save as HAR with content":
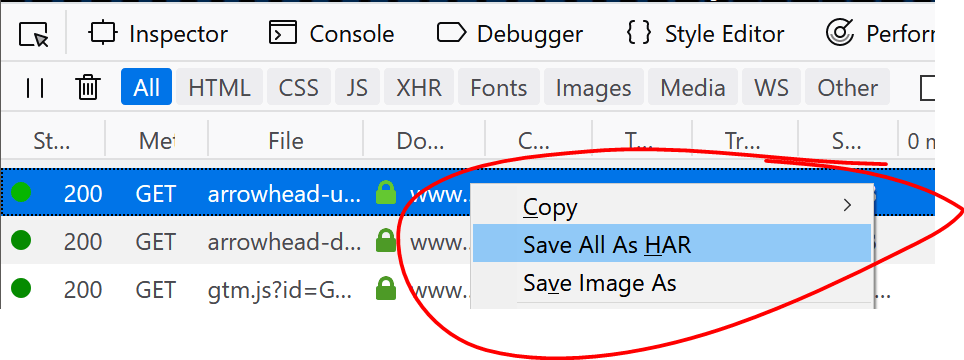
Mozilla Firefox
- Open the Dev Tools by pressing F12
- Select the Network Tab
- Refresh the page (if needed) and reproduce the problem
- Right click anywhere in the list of requests and choose "Save All As HAR"
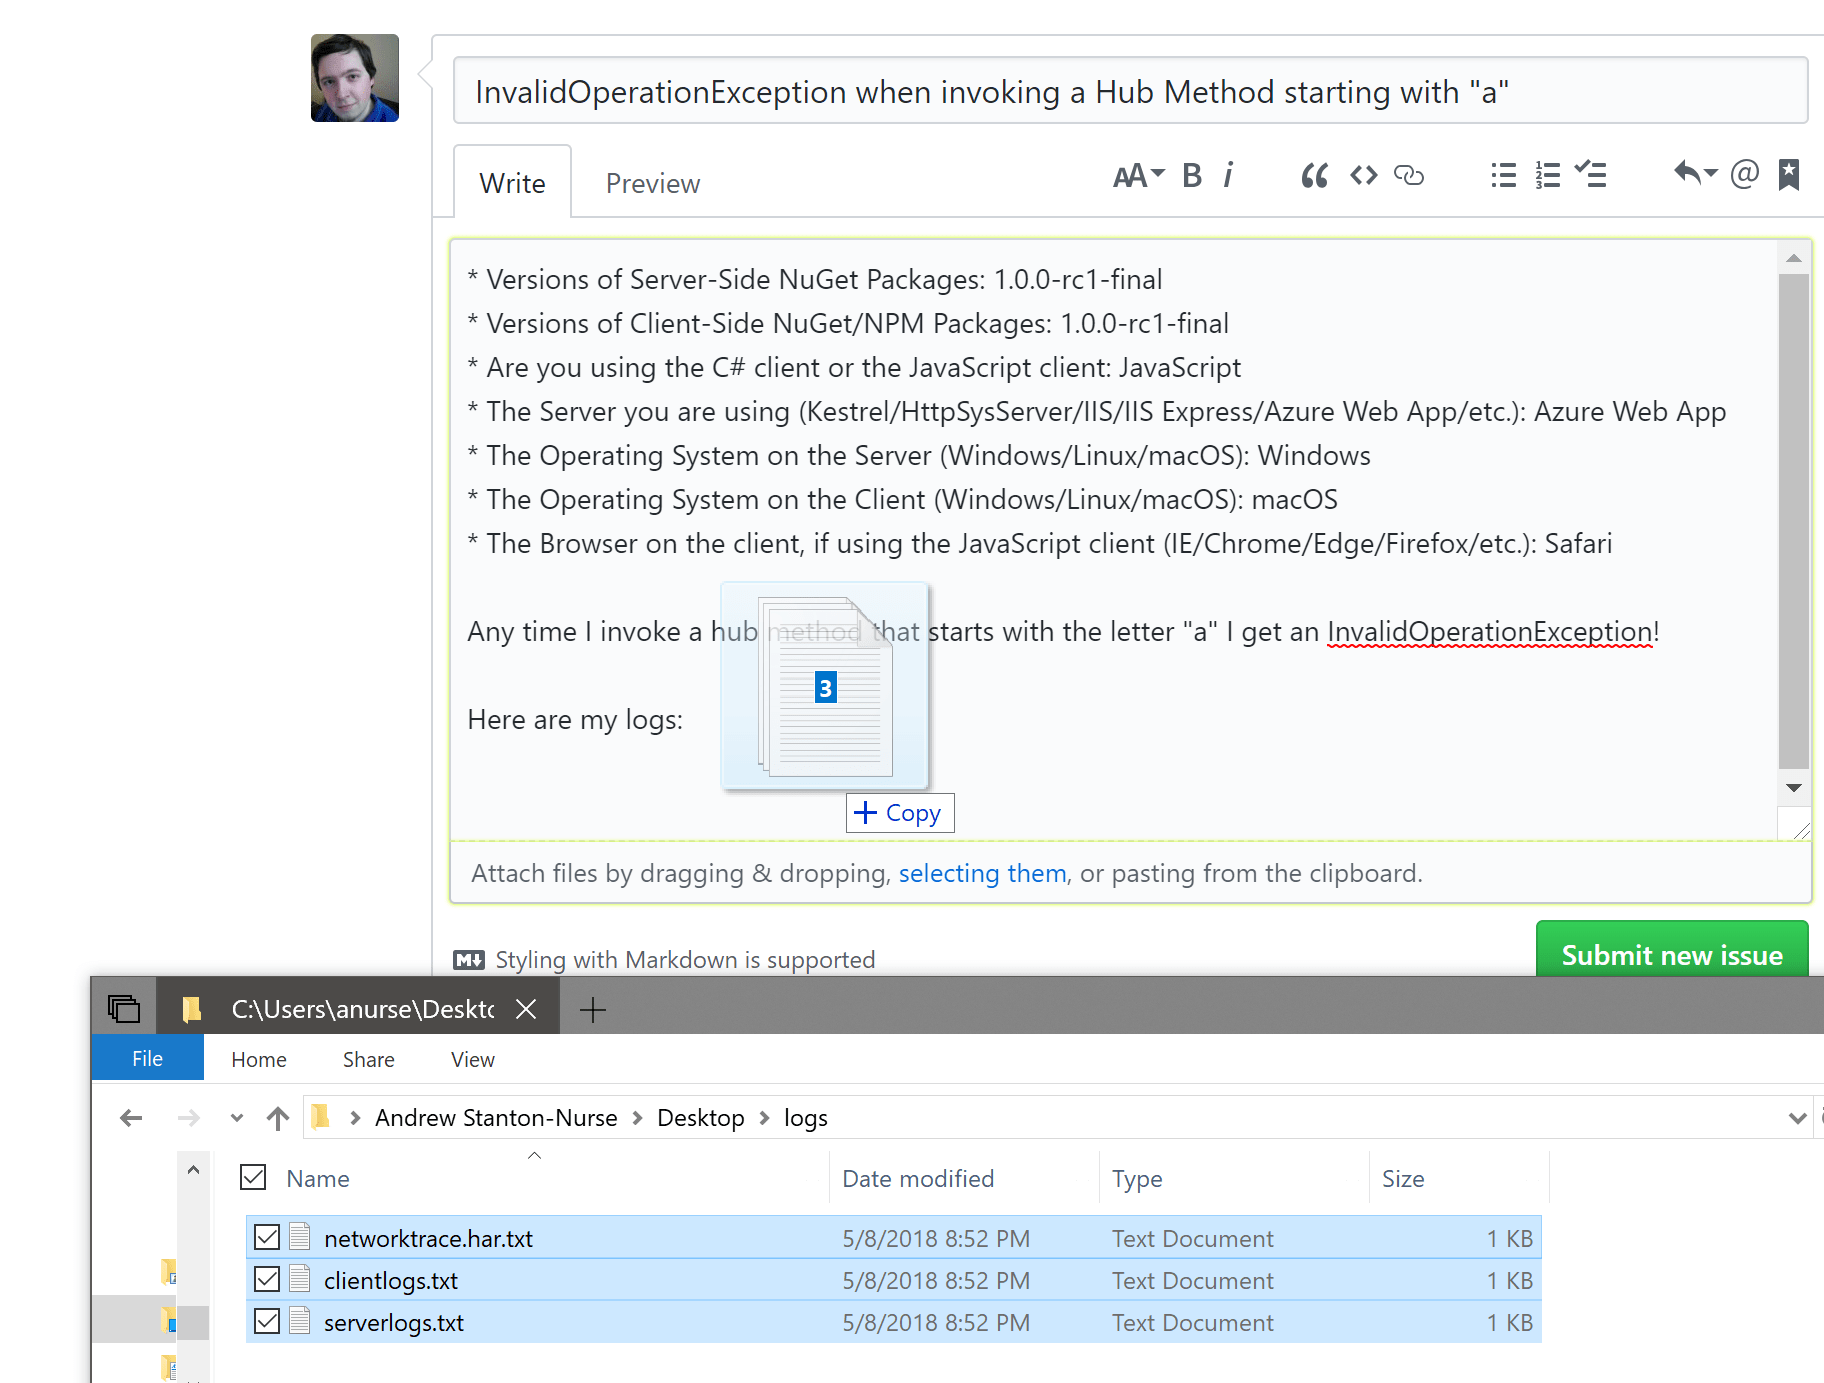
Attach diagnostics files to GitHub issues
Diagnostics files can be attached to GitHub issues by renaming them so they have a .txt extension and then dragging and dropping them on to the issue.
Note
Please don't paste the content of log files or network traces into a GitHub issue. These logs and traces can be large, and GitHub usually truncates them.
Metrics
Metrics are a representation of data measures over intervals of time. For example, requests per second. Metrics data allows observation of the state of an app at a high level. .NET gRPC metrics are emitted using EventCounter.
SignalR server metrics
SignalR server metrics are reported on the Microsoft.AspNetCore.Http.Connections event source.
| Name | Description |
|---|---|
connections-started |
Total connections started |
connections-stopped |
Total connections stopped |
connections-timed-out |
Total connections timed out |
current-connections |
Current connections |
connections-duration |
Average connection duration |
Observe metrics
dotnet-counters is a performance monitoring tool for ad-hoc health monitoring and first-level performance investigation. Monitor a .NET app with Microsoft.AspNetCore.Http.Connections as the provider name. For example:
> dotnet-counters monitor --process-id 37016 --counters Microsoft.AspNetCore.Http.Connections

Press p to pause, r to resume, q to quit.
    Status: Running
[Microsoft.AspNetCore.Http.Connections]
    Average Connection Duration (ms)       16,040.56
    Current Connections                         1
    Total Connections Started                   8
    Total Connections Stopped                   7
    Total Connections Timed Out                 0
Additional resources
Collaborate with us on GitHub
The source for this content can be found on GitHub, where you can also create and review issues and pull requests. For more information, see our contributor guide.
ASP.NET Core