Note
Access to this page requires authorization. You can try signing in or changing directories.
Access to this page requires authorization. You can try changing directories.
Use Microsoft Foundry Toolkit for Visual Studio Code to collect local traces or view telemetry for agents deployed to Microsoft Foundry. A trace groups recorded operations for a request. Each operation is a span with timing, status, and any attributes or events supplied by the instrumentation.
This article covers local collection first, then cloud tracing for deployed agents. Choose the data source that matches your investigation:
| Approach | Use it for | Data and responsibilities |
|---|---|---|
| Agent Inspector | Send a local request, inspect live response and tool events, or pause code at a breakpoint. | The server supplies protocol events and development diagnostics. This approach doesn't require the OTLP collector or create cloud trace history. |
| Local tracing | Compare recorded model, tool, and agent spans during development. | Your application exports telemetry to the Toolkit's local collector. You configure instrumentation and manage the stored local data. |
| Hosted-agent tracing | Investigate requests handled by an agent deployed to Foundry. | Traces reside in the project's connected Application Insights resource. Access, retention, and charges follow the Azure resource configuration. |
A hosted agent runs your custom code in Foundry Agent Service. Foundry manages hosting, but you remain responsible for the code and dependencies. Tracing doesn't replace agent creation and deployment.
Prerequisites
- Visual Studio Code with the current public Foundry Toolkit extension. See Install Foundry Toolkit.
- An application you can run locally, with its model and tool connections configured.
- For the first example, a Python Microsoft Agent Framework application and its selected Python environment. For other SDKs, use the Python or JavaScript and TypeScript setup.
- For cloud tracing, a deployed agent and an Application Insights resource connected to its Foundry project, or permission to connect or create one.
- For cloud queries, the Log Analytics Reader role on the connected Application Insights resource. For protected tables, also assign the Privileged Monitoring Data Reader role. See the Foundry tracing prerequisites.
Local collection doesn't require Application Insights or cloud telemetry permissions. Model calls and tool execution can still use remote services and incur charges.
Collect local traces
The local collector receives telemetry over OpenTelemetry Protocol (OTLP). It doesn't instrument an application automatically. Your framework or an instrumentation library must create spans and export them to the collector.
SDK and language setup
SDKs with built-in instrumentation still need an exporter. Other SDKs use a separate instrumentation package.
| SDK or framework | Python | JavaScript and TypeScript (Node.js) |
|---|---|---|
| Microsoft Agent Framework | Built-in OpenTelemetry instrumentation. | No dedicated Toolkit setup guidance. |
| Azure AI Inference SDK (preview) | Azure SDK instrumentor. | Azure SDK instrumentation. |
| Foundry Projects SDK | Client-side instrumentor (preview). | Instrument the underlying OpenAI or Azure SDK client. |
| Foundry classic Agents SDK | Azure SDK instrumentor. | No dedicated Toolkit setup guidance. |
| Anthropic | OpenLLMetry instrumentor. | Traceloop instrumentation. |
| Google GenAI (Gemini) | Google GenAI OpenTelemetry instrumentor. | No dedicated Toolkit setup guidance. |
| LangChain | OpenLLMetry instrumentor. | Traceloop instrumentation. |
| OpenAI SDK, including Azure OpenAI clients | OpenLLMetry instrumentor. | Traceloop instrumentation. |
| OpenAI Agents SDK | OpenLLMetry trace processor. | No dedicated Toolkit setup guidance. |
"No dedicated Toolkit setup guidance" means there's no SDK-specific setup path here for that language, not that the collector rejects its telemetry. The collector accepts OTLP data. The instrumentor determines which operations and message details are captured.
These examples use selected instrumentation options, not an exhaustive list of compatible libraries. OpenLLMetry and Traceloop instrumentation are non-Microsoft libraries.
Set up instrumentation
Use this procedure with an existing Python Agent Framework application. Keep the agent and collector in the same local environment for this walkthrough.
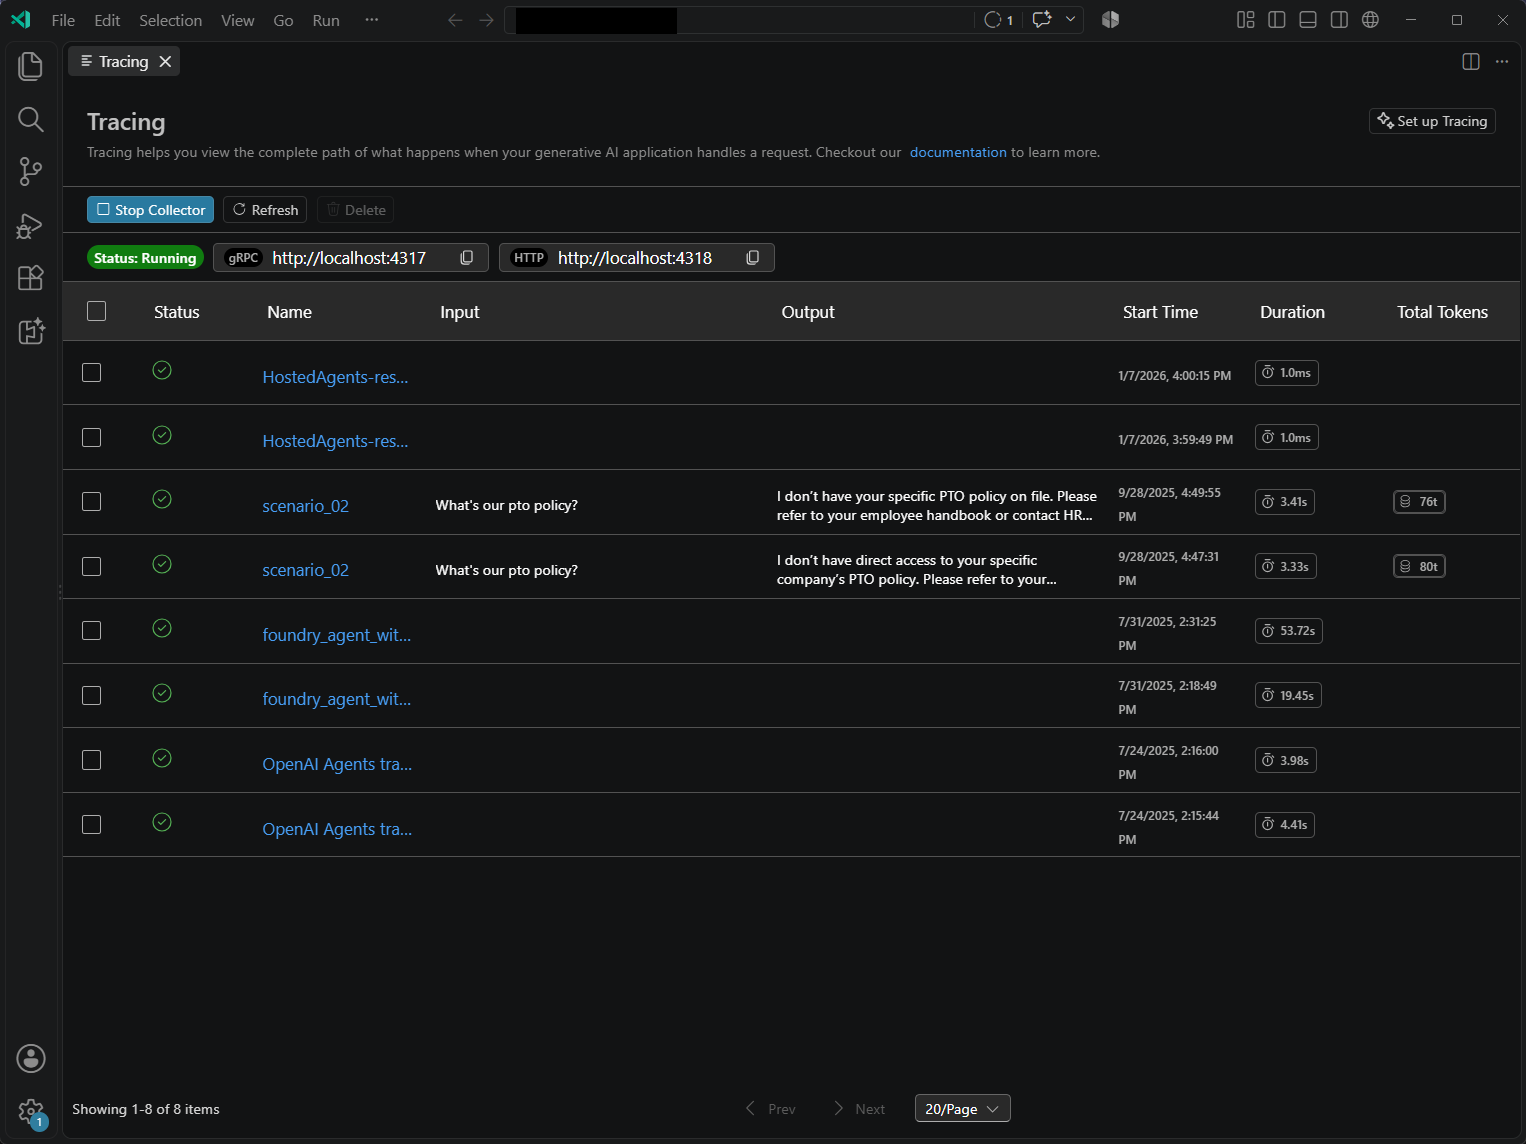
Select Foundry Toolkit in the Activity Bar, then Developer Tools > Monitor > Tracing.
Select Start Collector before running your application.
In the application's Python environment, install the gRPC exporter if it isn't already declared in your dependencies:
python -m pip install opentelemetry-exporter-otlp-proto-grpcReference: OpenTelemetry Python OTLP exporters.
Configure OpenTelemetry once at application startup, before constructing or running the agent:
import os

os.environ["OTEL_EXPORTER_OTLP_ENDPOINT"] = "http://localhost:4317"
os.environ["OTEL_EXPORTER_OTLP_PROTOCOL"] = "grpc"

from agent_framework.observability import configure_otel_providers

configure_otel_providers(enable_sensitive_data=False)
Reference: Agent Framework observability.
If your application or hosting library already configures OpenTelemetry providers, configure its existing exporters instead of adding another provider setup. Signal-specific
OTEL_EXPORTER_OTLP_*_ENDPOINTvariables can override the base endpoint. Check for existing trace, log, or metric settings that point elsewhere.Run the application with its normal entry point and send a request that exercises the agent. Let the request finish and give the exporter time to send telemetry before stopping the process.
In Tracing, select Refresh, then select the new trace to inspect its spans.
Agent Framework instruments supported model clients, agents, and workflow operations. Other frameworks can require an instrumentation library. OTLP compatibility lets the collector receive data, while emitted attributes and generative AI semantic conventions determine what the viewer displays.
For another SDK or language, use the setup below instead of the Agent Framework configuration. Start the collector first, configure instrumentation before creating clients, then run your application and refresh the trace list.
Collector endpoints
Match the exporter protocol to the collector endpoint. The Toolkit listens on localhost with these defaults:
| Exporter | Endpoint |
|---|---|
| OTLP gRPC | http://localhost:4317 |
| OTLP HTTP trace exporter | http://localhost:4318/v1/traces |
| OTLP HTTP log exporter | http://localhost:4318/v1/logs |
Some HTTP exporters accept http://localhost:4318 and append the signal path themselves. Follow your exporter's configuration rather than appending the path twice. Some instrumentation libraries send message content as log records, so exporting spans alone might not provide input and output details.
These ports are unrelated to the agent HTTP server and debugger ports. In a container or remote development environment, localhost refers to that environment. Establish the appropriate connection to the collector rather than assuming it refers to your desktop.
Python SDK setup
The following examples assume your application already has its model SDK, credentials, and model configuration. Install the shared dependencies and the additional package for your SDK from the following table:
python -m pip install opentelemetry-sdk opentelemetry-exporter-otlp-proto-http
Reference: OpenTelemetry Python SDK, OTLP exporters.
Add this shared setup once at application startup, followed by the instrumentation from one table row. Don't combine it with another library's provider setup.
import os

os.environ["TRACELOOP_TRACE_CONTENT"] = "false"
os.environ["OTEL_INSTRUMENTATION_GENAI_CAPTURE_MESSAGE_CONTENT"] = "false"
os.environ["AZURE_TRACING_GEN_AI_CONTENT_RECORDING_ENABLED"] = "false"

from opentelemetry import trace
from opentelemetry.sdk.resources import Resource
from opentelemetry.sdk.trace import TracerProvider
from opentelemetry.sdk.trace.export import BatchSpanProcessor
from opentelemetry.exporter.otlp.proto.http.trace_exporter import (
    OTLPSpanExporter,
)

provider = TracerProvider(
    resource=Resource.create({"service.name": "my-agent"})
)
provider.add_span_processor(BatchSpanProcessor(
    OTLPSpanExporter(endpoint="http://localhost:4318/v1/traces")
))
trace.set_tracer_provider(provider)
Reference: TracerProvider and span processors, OTLPSpanExporter.
Install the package in your chosen row with python -m pip install <package>. The OpenAI, Anthropic, LangChain, and separate OpenAI Agents examples use non-Microsoft OpenLLMetry instrumentation. SDK versions and model APIs can produce different details.
| SDK | Additional package | Instrumentation after the shared setup |
|---|---|---|
| OpenAI, including Azure OpenAI clients | opentelemetry-instrumentation-openai |
from opentelemetry.instrumentation.openai import OpenAIInstrumentorOpenAIInstrumentor().instrument() |
| Anthropic | opentelemetry-instrumentation-anthropic |
from opentelemetry.instrumentation.anthropic import AnthropicInstrumentorAnthropicInstrumentor().instrument() |
| LangChain | opentelemetry-instrumentation-langchain |
from opentelemetry.instrumentation.langchain import LangchainInstrumentorLangchainInstrumentor().instrument() |
| Google GenAI | opentelemetry-instrumentation-google-genai |
os.environ["OTEL_INSTRUMENTATION_GENAI_CAPTURE_MESSAGE_CONTENT"] = "NO_CONTENT"from opentelemetry.instrumentation.google_genai import GoogleGenAiSdkInstrumentorGoogleGenAiSdkInstrumentor().instrument() |
| Foundry Projects client-side tracing (preview) | azure-core-tracing-opentelemetry, alongside azure-ai-projects |
os.environ["AZURE_EXPERIMENTAL_ENABLE_GENAI_TRACING"] = "true"from azure.ai.projects.telemetry import AIProjectInstrumentorAIProjectInstrumentor().instrument(enable_content_recording=False) |
| Foundry classic Agents SDK | azure-core-tracing-opentelemetry, alongside azure-ai-agents |
os.environ["AZURE_SDK_TRACING_IMPLEMENTATION"] = "opentelemetry"from azure.ai.agents.telemetry import AIAgentsInstrumentorAIAgentsInstrumentor().instrument() |
| Azure AI Inference SDK (preview) | azure-core-tracing-opentelemetry, alongside azure-ai-inference |
os.environ["AZURE_SDK_TRACING_IMPLEMENTATION"] = "opentelemetry"from azure.ai.inference.tracing import AIInferenceInstrumentorAIInferenceInstrumentor().instrument() |
For Foundry Projects, follow the client-side tracing guidance and create its OpenAI client after instrumentation. This guidance differs from the classic Agents SDK. Don't instrument the same OpenAI calls with both AIProjectInstrumentor and a separate OpenAI instrumentor.
For OpenAI Agents SDK, install opentelemetry-instrumentation-openai-agents and add this code after the shared setup:
from agents import set_trace_processors
from opentelemetry.instrumentation.openai_agents import OpenAIAgentsInstrumentor

set_trace_processors([])
OpenAIAgentsInstrumentor().instrument()
Reference: OpenAI Agents instrumentation, OpenAI Agents tracing.
This example replaces existing trace processors before adding the OpenTelemetry processor. Without that replacement, the SDK can also export traces to its default backend. If you need existing processors, review the tracing destinations before changing them. Keep SDK tracing enabled so the OpenTelemetry processor receives events.
After a short-lived application finishes its requests, call provider.force_flush() before exiting to send buffered spans. For help adapting these snippets, use the Toolkit's Tracing Code Gen tool.
Export message log records
Some instrumentors emit message content as OpenTelemetry log records rather than span attributes. If you choose to record that content in a controlled development test, add this setup once alongside the preceding Python trace provider:
from opentelemetry import _logs
from opentelemetry.sdk._logs import LoggerProvider
from opentelemetry.sdk._logs.export import BatchLogRecordProcessor
from opentelemetry.exporter.otlp.proto.http._log_exporter import OTLPLogExporter

logger_provider = LoggerProvider(resource=provider.resource)
logger_provider.add_log_record_processor(BatchLogRecordProcessor(
    OTLPLogExporter(endpoint="http://localhost:4318/v1/logs")
))
_logs.set_logger_provider(logger_provider)
Reference: OpenTelemetry Python logging SDK, OTLPLogExporter.
Call logger_provider.force_flush() before exiting a short-lived application. A log exporter doesn't turn on content capture by itself. Follow your instrumentor's content settings and the data-handling guidance.
JavaScript and TypeScript SDK setup
For Node.js applications, share one trace provider and register the instrumentation for your SDK. This example uses CommonJS and the OpenTelemetry JavaScript 2.x provider configuration. TypeScript applications compiled to CommonJS can use the same initialization order.
Your application must already have its model SDK, credentials, and model configuration. Install the shared dependencies and the OpenAI instrumentor:
npm install @opentelemetry/api @opentelemetry/sdk-trace-node \
  @opentelemetry/sdk-trace-base @opentelemetry/exporter-trace-otlp-proto \
  @opentelemetry/instrumentation @traceloop/instrumentation-openai
Reference: OpenTelemetry JavaScript exporters, OpenAI instrumentation.
Create tracing.cjs:
const { NodeTracerProvider } = require('@opentelemetry/sdk-trace-node');
const { BatchSpanProcessor } = require('@opentelemetry/sdk-trace-base');
const {
  OTLPTraceExporter
} = require('@opentelemetry/exporter-trace-otlp-proto');
const { registerInstrumentations } = require('@opentelemetry/instrumentation');
const { OpenAIInstrumentation } = require('@traceloop/instrumentation-openai');

const provider = new NodeTracerProvider({
  spanProcessors: [
    new BatchSpanProcessor(new OTLPTraceExporter({
      url: 'http://localhost:4318/v1/traces'
    }))
  ]
});
provider.register();

registerInstrumentations({
  instrumentations: [new OpenAIInstrumentation({ traceContent: false })]
});

module.exports = provider;
Reference: NodeTracerProvider, OpenAI instrumentation.
Load this file before importing or requiring your model SDK. For example, run node --require ./tracing.cjs app.cjs for a CommonJS application. For another SDK, replace the OpenAI package, import, and registration entry with the matching row:
| SDK | Instrumentation package | Import and registration entry |
|---|---|---|
| OpenAI, including Azure OpenAI clients | @traceloop/instrumentation-openai |
const { OpenAIInstrumentation } = require('@traceloop/instrumentation-openai');new OpenAIInstrumentation({ traceContent: false }) |
| Anthropic | @traceloop/instrumentation-anthropic |
const { AnthropicInstrumentation } = require('@traceloop/instrumentation-anthropic');new AnthropicInstrumentation({ traceContent: false }) |
| LangChain | @traceloop/instrumentation-langchain |
const { LangChainInstrumentation } = require('@traceloop/instrumentation-langchain');new LangChainInstrumentation({ traceContent: false }) |
| Azure SDK operations, including Azure AI Inference | @azure/opentelemetry-instrumentation-azure-sdk |
const { createAzureSdkInstrumentation } = require('@azure/opentelemetry-instrumentation-azure-sdk');createAzureSdkInstrumentation() |
The Traceloop packages are non-Microsoft instrumentation. For a Foundry Projects application, instrument the client that makes the model request. Azure SDK instrumentation doesn't replace OpenAI instrumentation for calls made through an OpenAI client.
For native ECMAScript modules, follow OpenTelemetry's ESM setup. Loading instrumentation after the target SDK can leave calls uninstrumented. At shutdown, await provider.shutdown() after requests complete to export buffered spans.
Important
These examples turn off message-content capture for the listed GenAI instrumentors. This isn't a general redaction guarantee. Review other exporters, SDK logging, span attributes, and custom instrumentation before sharing data. Check the linked instrumentor documentation for supported packages and APIs.
Inspect and manage local traces
Use the span tree to follow the request from agent orchestration to model and tool operations.
- Select a slow or failed span.
- Inspect its duration and status.
- Open Input + Output for recorded messages, when supplied by the instrumentation, or Metadata for span attributes.
The examples keep sensitive content capture off. Timing data without messages can be the expected result.
For a controlled Agent Framework development test, set enable_sensitive_data=True in its existing configuration to record supported prompt, response, and tool content. Restore it to False when the test is complete. Other instrumentors have their own content settings.
Caution
Content recording can capture personal data, secrets, tool arguments, and results. Use non-sensitive test data and minimize or redact content before it enters telemetry. Don't turn on production content recording solely to fill an empty input and output view.
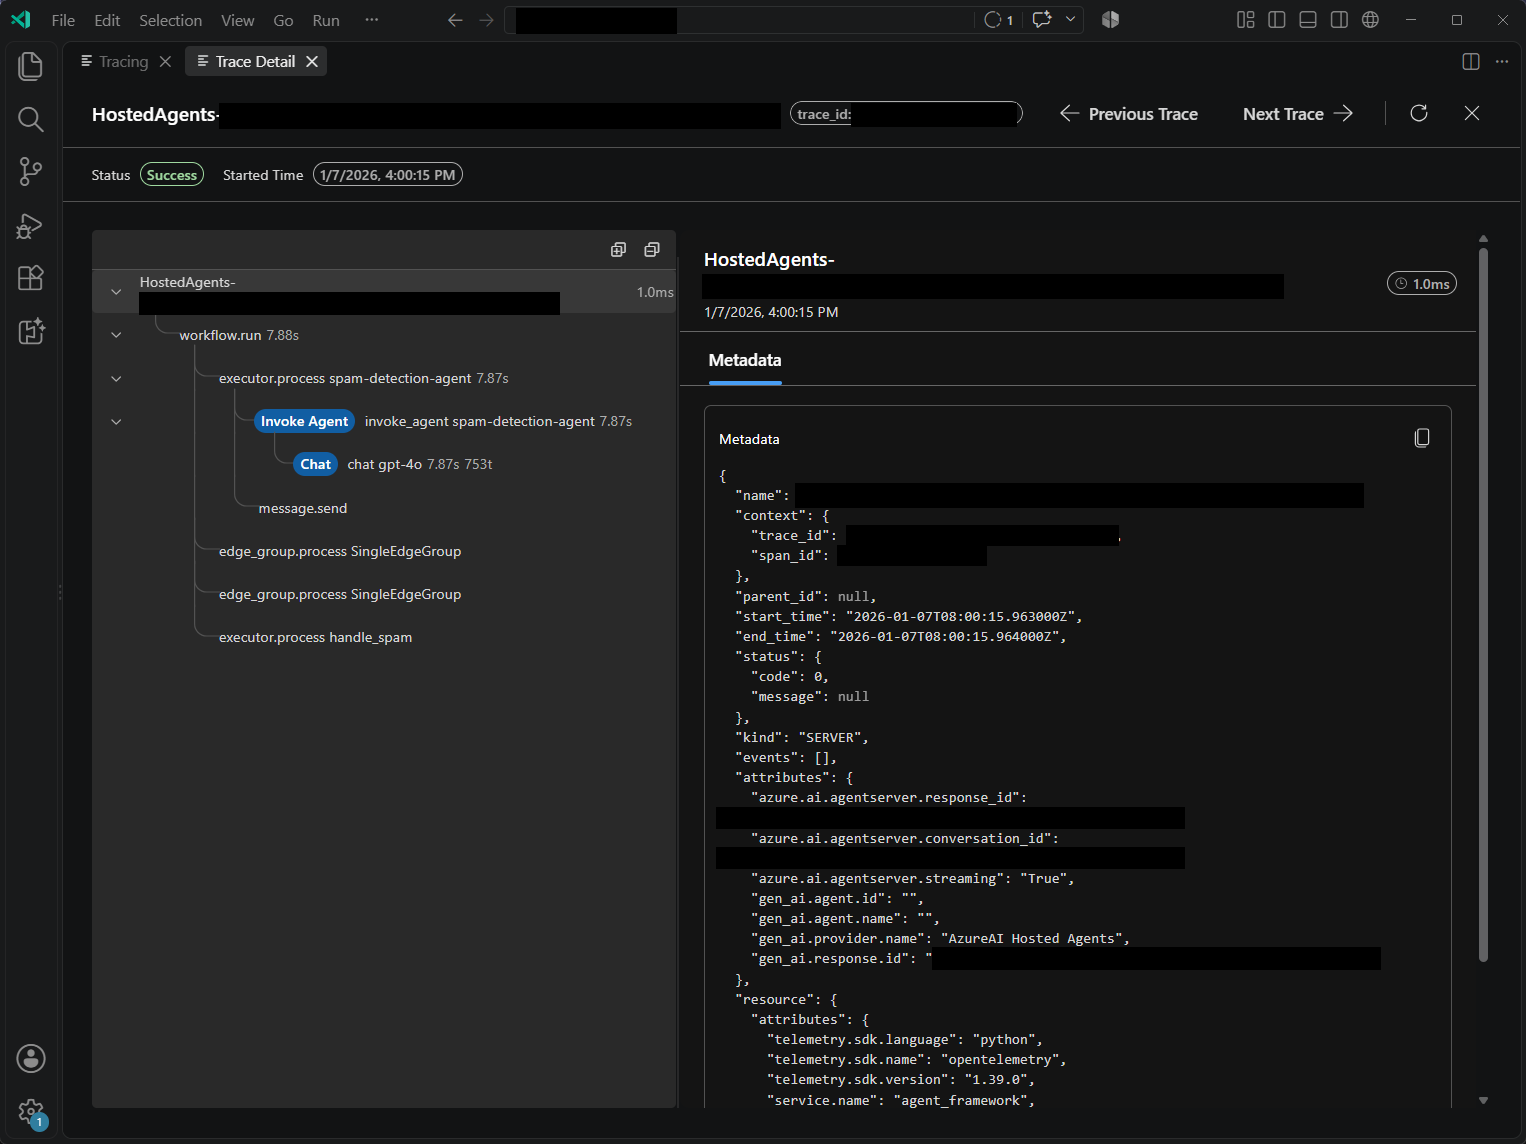
Collected traces persist in a local SQLite database named traces.db, in the tracing subdirectory of .aitk under your user home folder. Closing the viewer doesn't delete them.
Select Stop Collector to stop local collection. Your agent and its model calls continue running. To remove local records, select the traces in the list and select Delete.
Local storage is separate from Application Insights. Deleting local traces doesn't remove cloud telemetry, and clearing a conversation in Inspector doesn't delete either store.
View hosted-agent traces
After deployment, use cloud traces to investigate the agent running in Foundry rather than your local process. The Toolkit queries the project's connected Application Insights resource. It doesn't upload your local trace database.
Confirm the cloud prerequisites before starting. Access to the agent alone doesn't grant permission to query telemetry.
Connect Application Insights and inspect a request
Use the agent's Traces tab to connect Application Insights and find a deployed-agent request.
In the Foundry Toolkit sidebar, open My Resources > Agents. Select the Hosted Agent tab, then select the agent's name.
Select Traces. If the project has no connected resource, select Enable App Insights.
In App Insights Settings, select an existing Application Insights Resource Name. Alternatively, choose to create a resource and complete the required resource and workspace fields. Select Submit and wait for confirmation.
This changes the project's shared Application Insights connection, not a local workspace preference. Resource creation and telemetry collection can incur Azure charges. Confirm the intended project and resource before submitting.
Return to Playground and send a test request to the deployed agent.
Allow time for ingestion, then open Traces again. Use the time range, Search by conversation ID, Status, or Duration filters to locate the request.
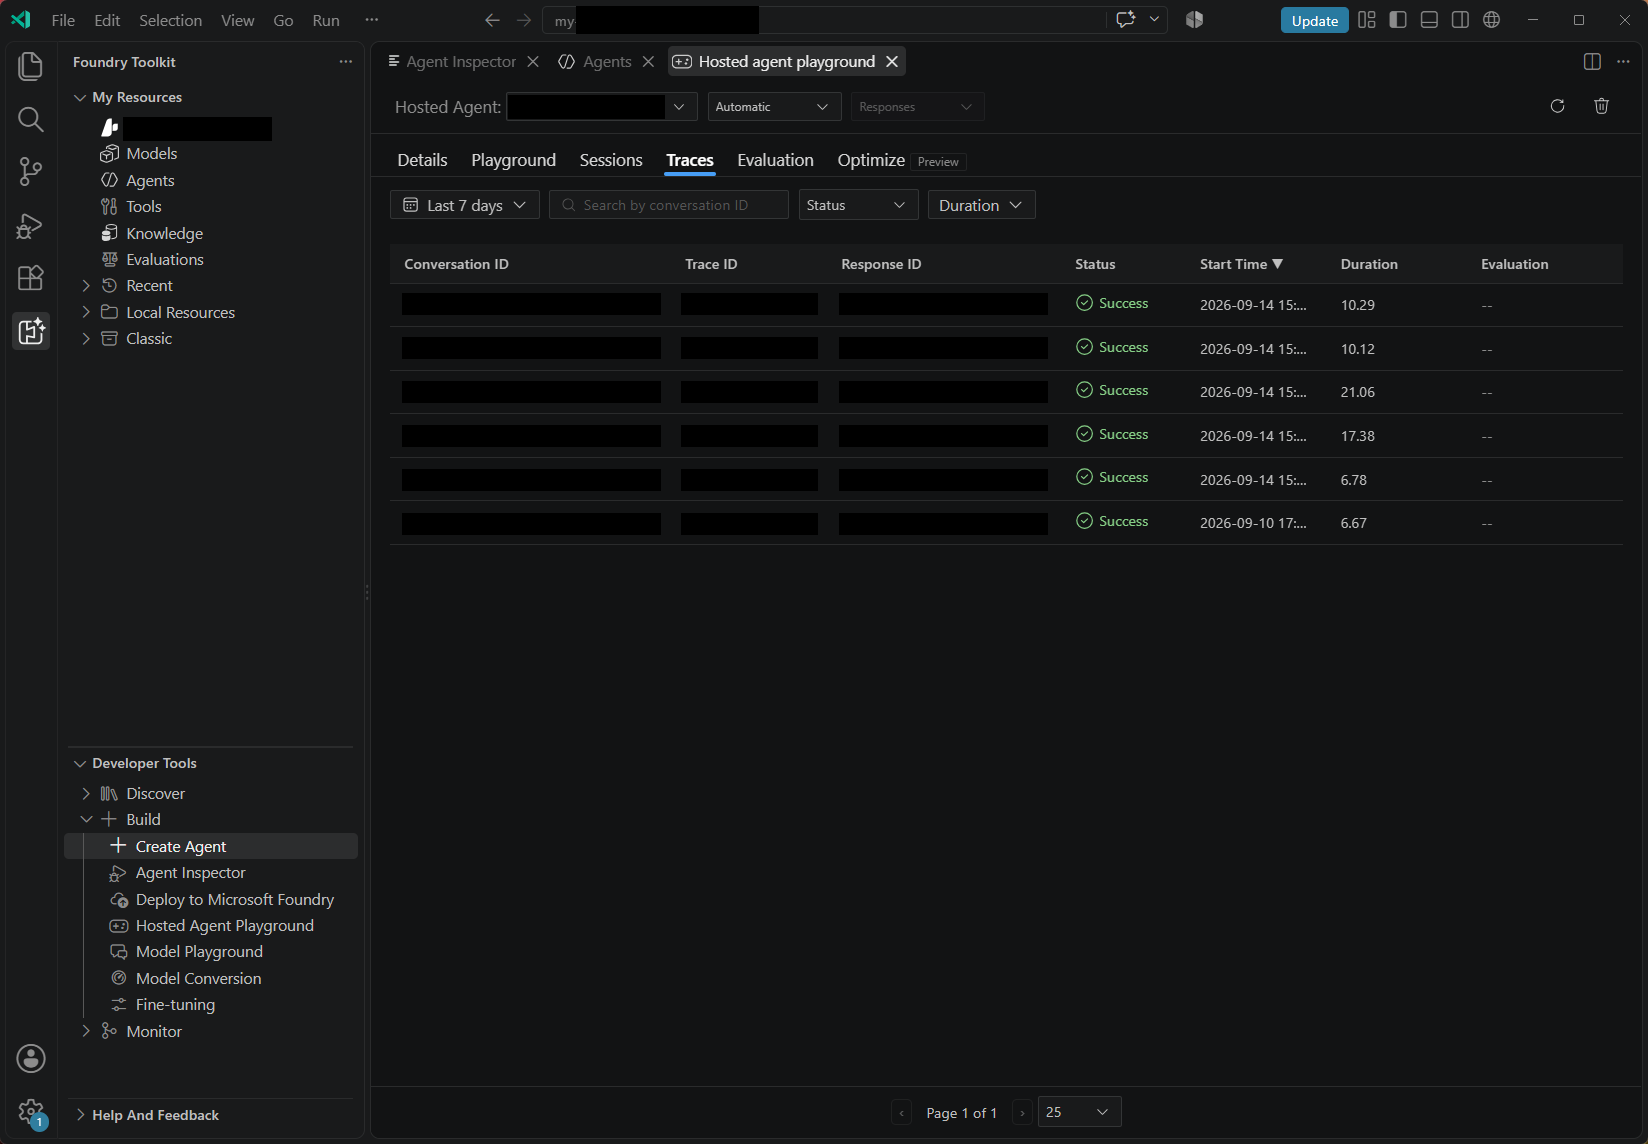
Select a trace, then a span, to review Metadata and Input + Output, when content is available.
To inspect operations associated with a conversation, select its Conversation ID in the trace list. The conversation view shows an operation tree and metadata.
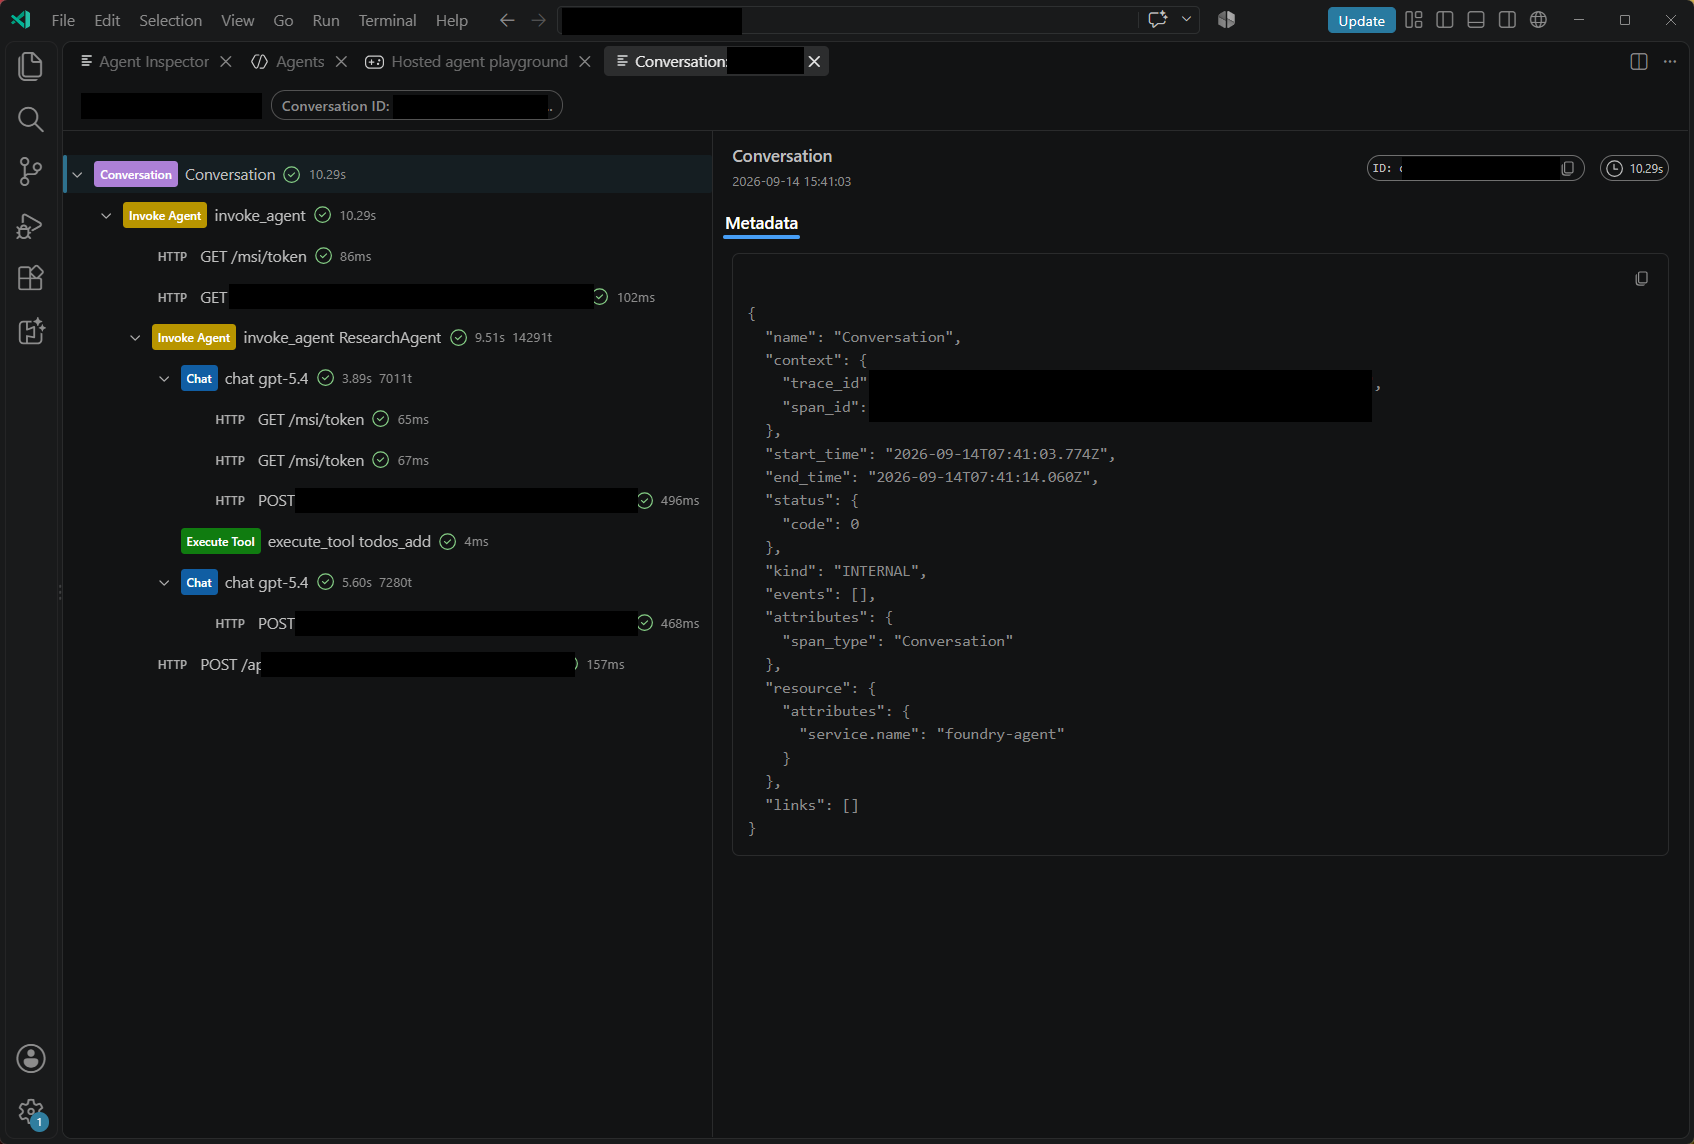
Connecting Application Insights enables Foundry's server-side tracing. Visibility into your model calls, tool calls, and custom code also depends on the hosting library and framework instrumentation. See Set up tracing in Foundry for service-side collection and additional client instrumentation.
The Toolkit's trace-detail query currently covers the last seven days. This is a query window, not a retention setting. For older data, use the Foundry portal or Azure Monitor, subject to the connected workspace's retention configuration.
Data, access, retention, and cost
Decide where telemetry should go before enabling content capture or connecting a cloud resource. The same request can generate local spans, cloud telemetry, and data sent to model or tool providers.
| Data source | Responsibilities |
|---|---|
| Local traces | Protect access to the local database and copied data. Stopping the collector doesn't stop other exporters configured in your application. |
| Cloud traces | Application Insights and Log Analytics control access, retention, and telemetry charges. Toolkit filters don't change those policies. |
| Model and tool calls | Local collection doesn't prevent requests from leaving your computer. Review every connected service's data handling, including non-Microsoft tools. |
Use the Foundry tracing guidance for security and privacy and data retention and cost. For production identity, network isolation, and downstream access, follow hosted-agent security and data handling. Don't treat local credentials as the deployed agent's permissions.
Troubleshooting
| Issue | What to check |
|---|---|
| Tracing isn't available in the sidebar. | Confirm the current extension is installed and enabled in the environment where you run it. Local tracing requires its native SQLite component to load. |
| The collector doesn't start. | Check for another process using port 4317 or 4318 and review the Toolkit output. Avoid competing collectors on the same ports. |
| A local request succeeds but no trace appears. | Confirm instrumentation runs before the request, the collector is running, and the exporter uses the correct protocol and endpoint. Check endpoint overrides, exporter errors, and buffered telemetry, then select Refresh. |
| Spans appear without messages. | Check content-recording settings and supported attributes. Some libraries also require a log exporter. Missing content doesn't necessarily mean collection failed. |
| Cloud traces are empty. | Confirm the project and Application Insights connection, generate new traffic, expand the time range, and allow for ingestion delay. |
| Cloud queries fail with an authorization error. | Check read access to Application Insights and Log Analytics, including protected tables, using the service prerequisites. |
| An older trace has no detail in the Toolkit. | The detail query covers seven days. Query older retained records in Foundry or Azure Monitor. |