Note
Access to this page requires authorization. You can try signing in or changing directories.
Access to this page requires authorization. You can try changing directories.
Important
Azure Data Studio is retiring on February 28, 2026. We recommend that you use the MSSQL extension for Visual Studio Code. For more information about migrating to Visual Studio Code, visit What's happening to Azure Data Studio?
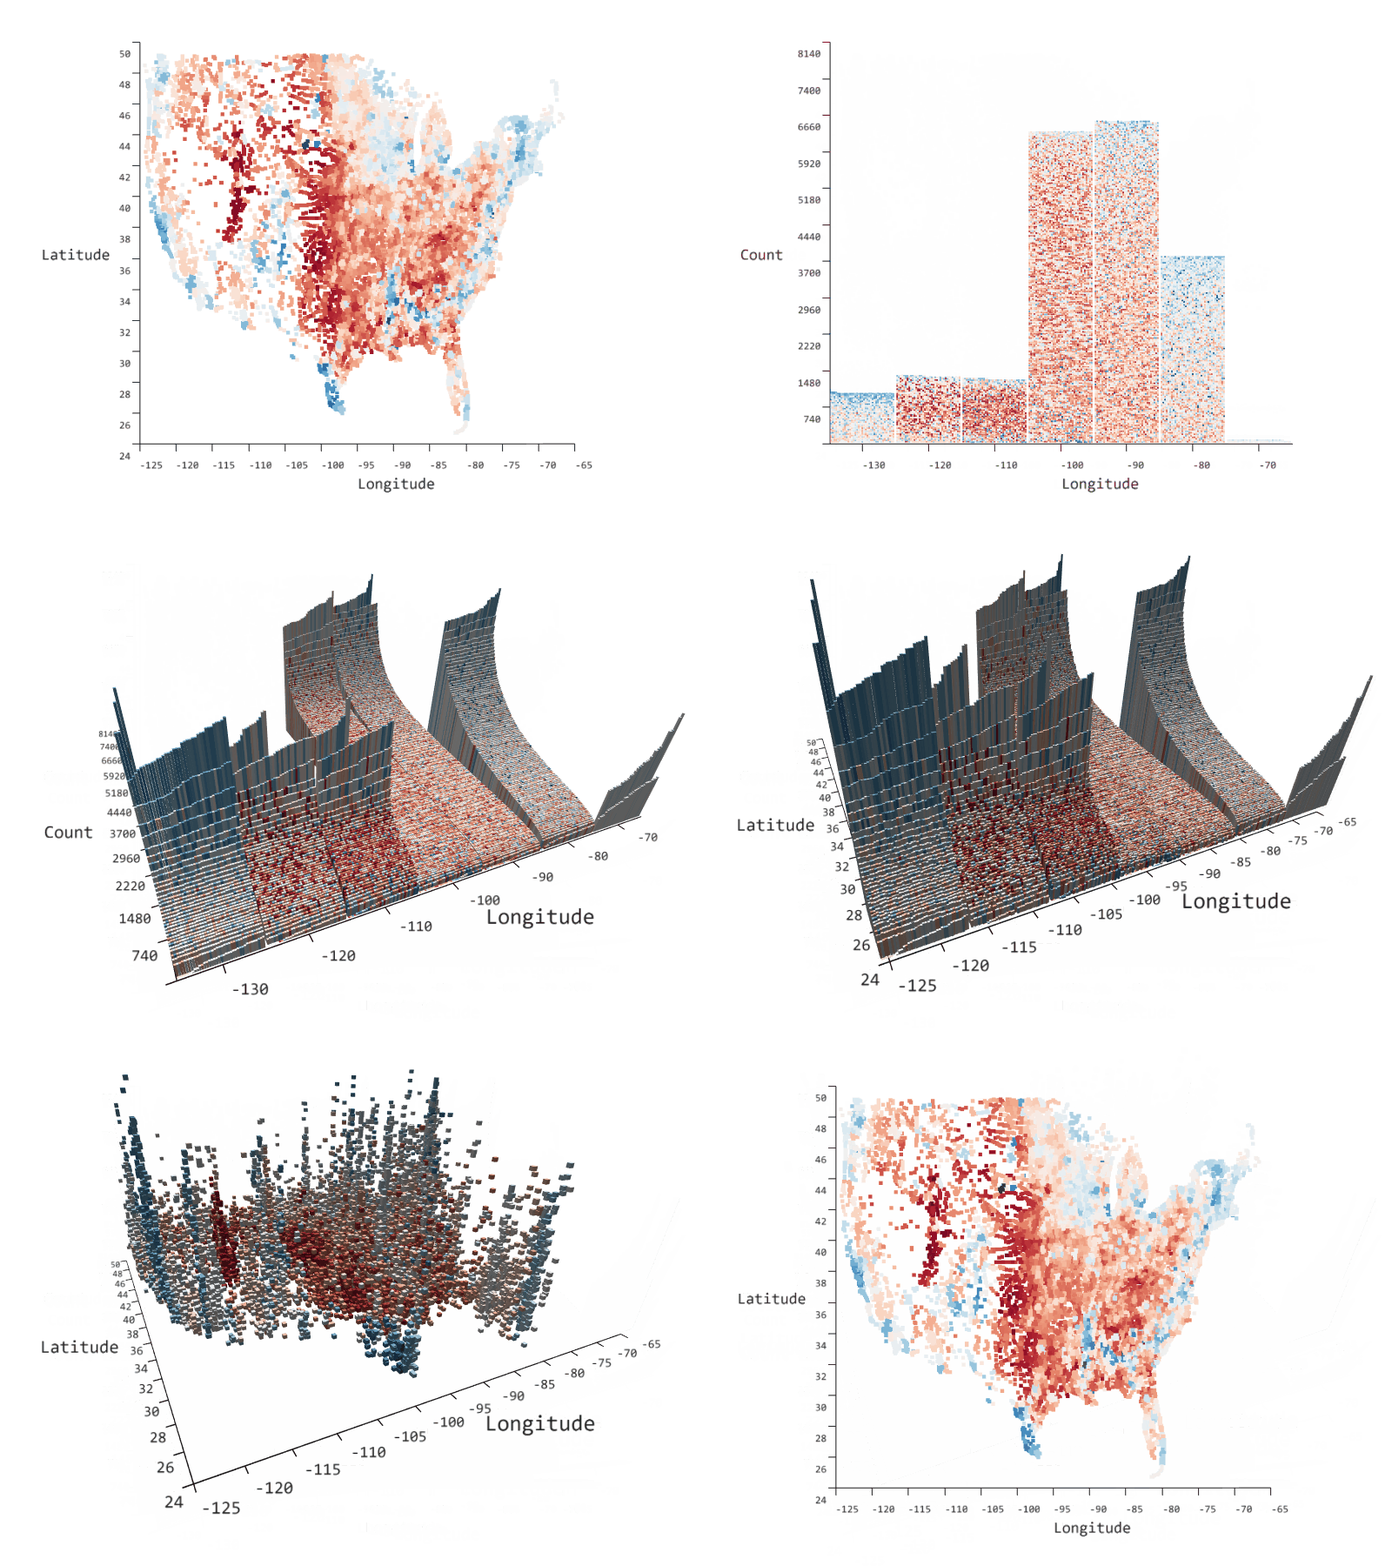
Azure Data Studio now offers a way to create quick visualizations for your data. This extension is helpful when you are trying to look at the data and understand what's going on. We use a technology called SandDance from Microsoft Research, which can generate in-place visualizations of the data.

By using easy-to-understand views, SandDance helps you find insights about your data, which in turn help you tell stories supported by data, build cases based on evidence, test hypotheses, dig deeper into surface explanations, support decisions for purchases, or relate data into a wider, real world context.
SandDance uses unit visualizations, which apply a one-to-one mapping between rows in your database and marks on the screen. Smooth animated transitions between views help you to maintain context as you interact with your data.
Usage
View .csv or .tsv files
This includes local files or files on HDFS in your SQL Server 2019 Big Data Cluster.
Starting from the File menu, use Open Folder or [Ctrl+K Ctrl+O] to open the directory containing the .CSV file. Next, from within the Explorer panel, Right-click on the .csv or .tsv file and choose View in SandDance.
Right-click on a .csv or .tsv file in HDFS if you are connected to SQL Server 2019 Big Data Cluster and choose View in SandDance.
View SQL query results
Starting from a SQL query window, execute a query to get a results grid. Click the Visualizer icon on the right side of the Results pane.
Known Issues
Currently, we do not cap the row count that is visualized. However, memory consumption goes up proportionally to the number of rows, so we recommend that the data set or view is limited to around 100k rows.
See known issues
Release Notes
1.0.0
Initial release of azdata-sanddance
Next Steps
To learn more, visit the GitHub repo.