Note
Access to this page requires authorization. You can try signing in or changing directories.
Access to this page requires authorization. You can try changing directories.
Important
Azure Data Studio is retiring on February 28, 2026. We recommend that you use the MSSQL extension for Visual Studio Code. For more information about migrating to Visual Studio Code, visit What's happening to Azure Data Studio?
This article shows you how to create and run an Azure Data Studio notebook using the Azure Monitor Log extension to connect to a Log Analytics workspace to view results for an Azure SQL database.
Once the Azure Monitor Logs extension is installed, you can connect to your Azure Monitor Log workspaces, browse the tables, write/execute KQL queries against workspaces and write/execute Notebooks connected to the Log Analytics kernel.
With the Azure Monitor Log extension, you can change the kernel option to Log Analytics.
This feature is currently in preview.
Prerequisites
If you don't have an Azure subscription, create a free Azure account before you begin.
The following prerequisites are also required:
- Azure SQL Database
- Azure Data Studio installed.
- Log Analytics workspace.
- Azure Monitor Log extension.
Connect to an Azure Monitor Logs (Log Analytics) workspace
There are two main tables in a Log Analytics (Azure Monitor Logs) workspace that capture Azure SQL events:
In the examples below, this article uses the AzureDiagnostics table and the AzureMetric table in a Log Analytics workspace, which store some Azure SQL event data. We have previously configured Azure SQL to write its selected events to a Log Analytics workspace. Learn more about how to do this here.
You can connect to a Log Analytics workspace.
Create an Azure Monitor Log notebook
The following steps show how to create a notebook file in Azure Data Studio:
In Azure Data Studio, connect to your Log Analytics workspace.
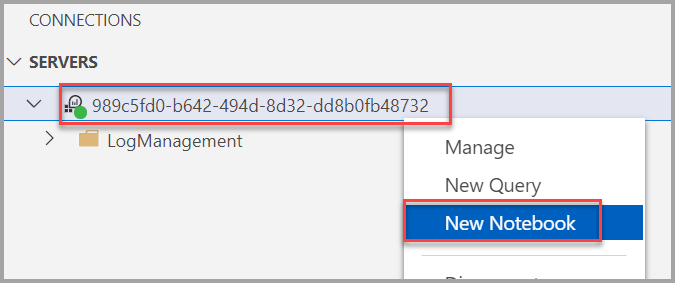
Navigate to the Connections pane and under the Servers window, right-click the Log analytics workspace and select New Notebook. You can also go to File > New Notebook.
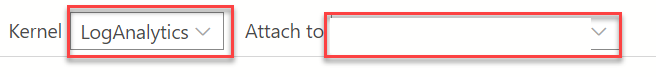
Select Log Analytics for the Kernel. Confirm that the Attach to menu is set to the workspace name.
You can save the notebook using the Save or Save as... command from the File menu.
To open a notebook, you can use the Open file... command in the File menu, select Open file on the Welcome page, or use the File: Open command from the command palette.
Change the connection
To change the Azure Monitor Log connection for a notebook:
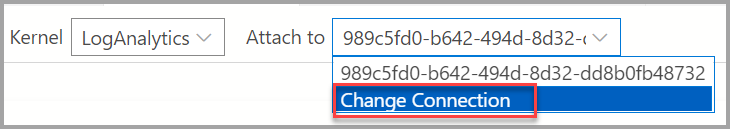
Select the Attach to menu from the notebook toolbar and then select Change Connection.
Note
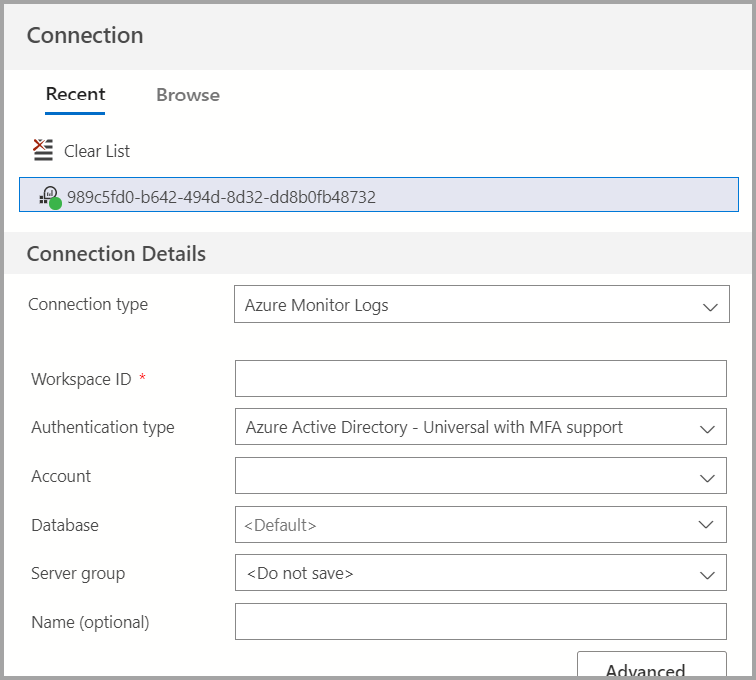
Ensure that the workspace value is populated. Azure Monitor Log notebooks require to have the Workspace ID specified in the Server field.
Now, you can either select a recent connection workspace or enter new connection details to connect.
Run a code cell
You can create cells containing KQL queries that you can run in place by selecting the Run cell button to the cell's left. The results are shown in the notebook after the cell runs.
For example:
Add a new code cell by selecting the +Code command in the toolbar.

Query log results for an Azure SQL database
You can connect to your Log Analytics workspaces to browse tables, write KQL queries against workspaces, and create notebooks connected to the Log Analytics kernel.
Note
Allow about 15 minutes before the log results appear.
Some sample queries are listed below.
AzureMetrics
Here's a sample query to view AzureMetrics results.
AzureMetrics

AzureDiagnostics
Here's a sample query to view AzureDiagnostics results.
The AzureDiagnostics table tends to have more details than AzureMetrics.
AzureDiagnostics
| project-away TenantId, ResourceId, SubscriptionId, _ResourceId, ResourceGroup // hide sensitive info
| take 10

Analyze events by Diagnostic Settings
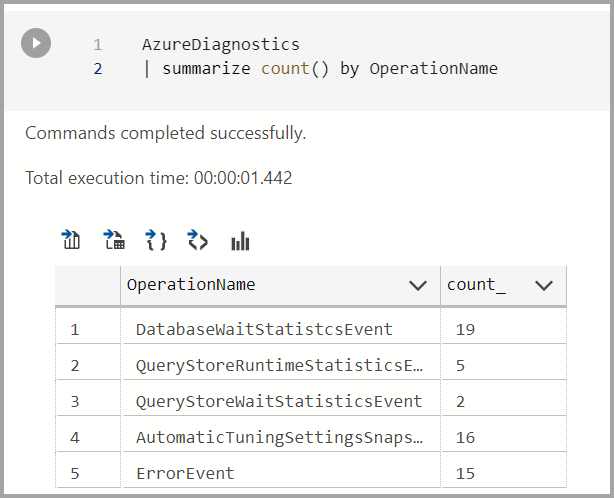
Here's a query to analyze the number of events by Operation Name.
Note
Each row in AzureDiagnostic represents an event for a specific Operation or category. Some SQL actions might result in generating multiple events of different types.
AzureDiagnostics
| summarize count() by OperationName
You can try some more examples from the Azure Monitor Logs samples repo.