Note
Access to this page requires authorization. You can try signing in or changing directories.
Access to this page requires authorization. You can try changing directories.
This topic provides details about memory use in high-level applications. See Manage memory and latency considerations for information about the memory available for real-time capable applications (RTApps).
High-level applications have access to the following memory and storage:
- 256 KiB RAM on the high-level core, reserved entirely for high-level application use. Up to 1 KiB of this space may be allocated for each shared buffer channel through which high-level applications and RTApps communicate.
- 1 MiB read-only flash memory, which is shared between the high-level and real-time cores.
- Read/write (mutable) storage, which persists when a device reboots. For information about mutable storage, see Using storage on Azure Sphere.
Note
Repeatedly updating the flash eventually wears it out and makes it invalid. Therefore, you should design your code to avoid unnecessary updates of the flash. For example, if you want to save your application state before exiting so that you can recover the saved state after a restart, consider saving the state of the application to the flash only if the state has changed.
Determine flash memory usage
To determine your flash memory usage, consider only the size of the image package file which includes the image metadata, application manifest, and the executable image. You don't need to account for the storage required by Microsoft-provided components, such as the Azure Sphere OS or the run-time services and shared libraries that control peripherals and enable connection to an Azure IoT Hub. Likewise, you don't need to include the size of a full backup copy of your application or the components that enable failover or rollback in case of corruption or problems with over-the-air updates.
During development and debugging, however, the size of the debugger does count against the limit. The debugger is automatically added by az sphere device enable-development and removed by [az sphere device enable-cloud-test](../reference/az sphere-device.md). You can find the size of the debugger used by your SDK by searching for gdbserver.imagepackage in the DebugTools folder of the Microsoft Azure Sphere SDK installation directory.
The az sphere device sideload command returns an error if the application image package and the debugger (if present) exceed the 1 MiB total limit. The az sphere image add --image command which uploads a new image to your Azure Sphere catalog also returns an error if the image package exceeds 1 MiB.
The 256 KiB RAM limit applies to the application alone; you don't need to allow for RAM used by the debugger. Additional memory is reserved for kernel allocations.
The available flash and RAM may increase (but will never decrease) for applications written for the current Azure Sphere chip (MT3620). Future Azure Sphere chips may have different limits.
Out of memory conditions
If your application uses too much RAM, the Azure Sphere OS terminates it with a SIGKILL signal. For example, in the debugger you'll see the following:
Child terminated with signal = 0x9 (SIGKILL)
The SIGKILL signal also occurs if a high-level application fails to exit after it receives the SIGTERM request. See Lifecycle of an application for details.
To help avoid crashes in your application due to out-of-memory condition, see best practices for managing RAM usage in high-level applications.
Determine run-time application RAM usage
Azure Sphere provides several functions for obtaining memory usage information at runtime. You can use these to monitor your high-level application's memory usage, allowing you to restart your application safely if memory usage exceeds a threshold you specify within the 256 KiB limit. The available functions are:
- Applications_GetTotalMemoryUsageInKB: Get the total memory usage in kibibytes. This is the total physical memory usage of your app on the system, including kernel allocations (such as buffers for sockets) on behalf of your app or the debugging server, returned as a raw value (in KiB).
- Applications_GetUserModeMemoryUsageInKB: Get the user mode memory usage in kibibytes. This is the amount of physical memory used directly by your app, the memory used by any libraries on its behalf (also referred to as anon allocations), and memory used by the debugging server, returned as a raw value (in KiB).
- Applications_GetPeakUserModeMemoryUsageInKB: Get the peak user mode memory usage in kibibytes. This is the maximum amount of user memory used in the current session. When testing memory usage of your application, you should ensure this value never exceeds 256 KiB. This value resets whenever your app restarts or is redeployed. Use this function to get an approximate look into how close your application is getting to the 256 KiB recommended limit.
To use these functions in your high-level application, include the applications.h header file. You can use these functions during development to get an idea of your application's overall memory use, but you can also use them together with logging to capture information from devices in the field. The Memory Overuse Detection and Cleanup snippet demonstrates how to detect and gracefully handle unexpected memory usage.
Note
These functions return the memory usage as seen by the OS. Currently, the freeing of memory by an application for allocations on the user heap is not reported by these functions. The memory will be returned to the malloc library for future use but the statistics reported by the OS remain unchanged unless the memory was allocated and freed by the OS itself. An example would be allocating memory for a socket. Therefore, these functions are useful for understanding worst-case scenarios to help your application operate conservatively for maximum reliability. Values are approximate and may vary across OS versions.
Add heap memory allocation tracking
You can obtain additional memory usage information by adding heap memory allocation tracking, which shows what user and kernel allocations are being made by static and dynamically linked libraries. This provides a fuller picture of where memory is being used by your application to help you use it most effectively. This feature, available with the Azure Sphere OS version 21.07 or later and application runtime version (ARV) 10 or later, works only on a development-enabled device and only when the application is not running under the debugger.
Note
You must complete both the configuration tasks described in this section for heap memory allocation tracking to work correctly. If you fail to do so, a warning will be reported during compilation and heap memory information will not be displayed.
To enable heap memory allocation tracking, you need to do two things:
Add the HeapMemStats capability to your application's app-manifest.json file:
  "Capabilities": {
    "HeapMemStats": true
  },
Add the libmalloc library to your image package by adding
DEBUG_LIB "libmalloc"to theazsphere_target_add_imagecommand in your application's CMakeLists.txt file:azsphere_target_add_image_package(${PROJECT_NAME} DEBUG_LIB "libmalloc")
Important
Because heap memory allocation tracking works only on development-enabled devices, you should do the following to remove it from your application before building image packages for deployment:
- Delete the line '"HeapMemStats": true' from your application's app-manifest.json file.
- Remove
DEBUG_LIB "libmalloc"from theazsphere_target_add_image_package(${PROJECT_NAME} DEBUG_LIB "libmalloc"command in your application's CMakeLists.txt file.
Use the Visual Studio performance profiler
If you use Visual Studio, you can use its performance profiler feature to get information about application memory usage. For a tutorial that uses this profiler, see Tutorials/MemoryUsage.
Prerequisites
- An Azure Sphere development kit connected to your PC running Visual Studio with the Azure Sphere SDK installed. See Install the Azure Sphere SDK for Windows.
- A device prepared for development. See az sphere device enable-development. The performance profiler will not return data if your device is not enabled for development.
Start the memory usage profiler
Select Debug > Performance Profiler or press Alt+F2 to open the performance profiler start window.
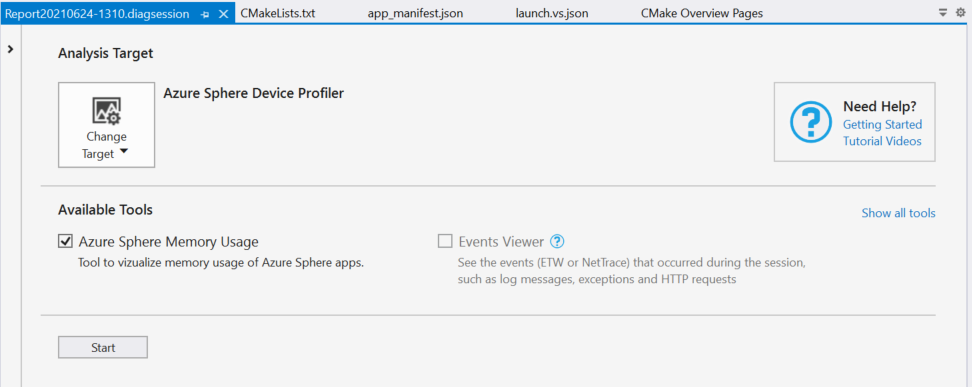
Under Analysis Target, if Azure Sphere Device Profiler is not visible, select Choose Target and select Azure Sphere Device Profiler.
Under Available Tools, ensure Azure Sphere Memory Usage is checked, then select Start to open the memory usage profiling window and start the memory profiler.
If you need to deploy or restart your application, select Debug > Start Without Debugging or press Ctrl+F5 to deploy your application to the device.
Important
To get accurate RAM usage information for your application, it is important that you [start your app without debugging](buid-hl-app.md#build-and-deploy-the-application-in- visual-studio-without-debugging). Running your app under the debugger will result in inflated RAM usage, because memory consumed by the debugging server will be included in the reported RAM usage statistics.
Interpreting the memory usage profiler data
The memory usage profiling window displays a view like the following:
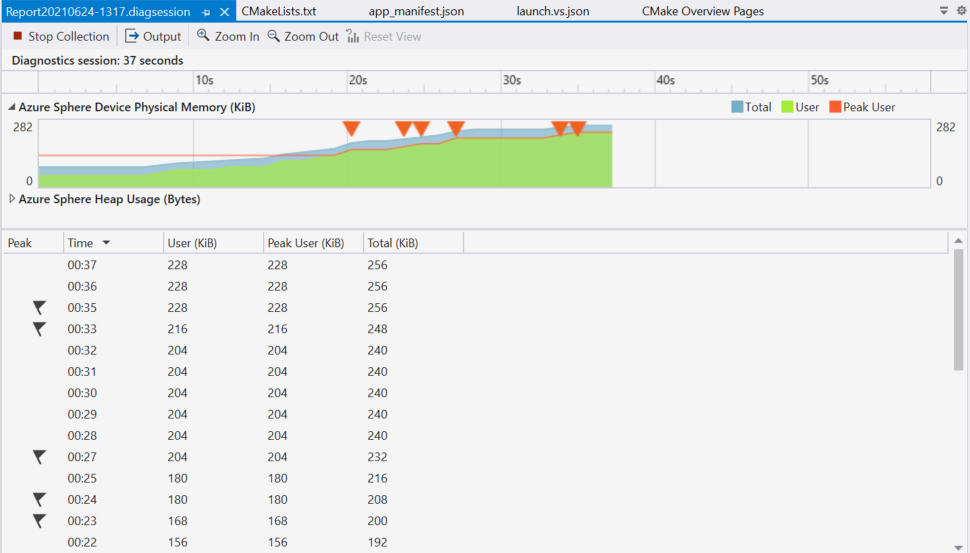
In the center of the view, an Azure Sphere Device Physical Memory graph plots three different RAM usage statistics (shown to the nearest KiB) as three different lines while your app is running:
- Total: The total physical memory usage of your app on the system, including kernel allocations (such as buffers for sockets) on behalf of your app or the debugging server.
- User: The amount of physical memory used directly by your app, the memory used by any libraries on its behalf (also referred to as anon allocations), and memory used by the debugging server.
- Peak User: The maximum amount of user memory used in the current session. When testing memory usage of your application, you should ensure this value never exceeds 256 KiB. Additional memory is reserved for kernel allocations. This value resets whenever your app restarts or is redeployed.
The graph also plots occurrences of the New Peak event (represented by a triangle). This event occurs whenever there is a new maximum for Peak User memory usage. The event is enabled for screen reader accessibility.
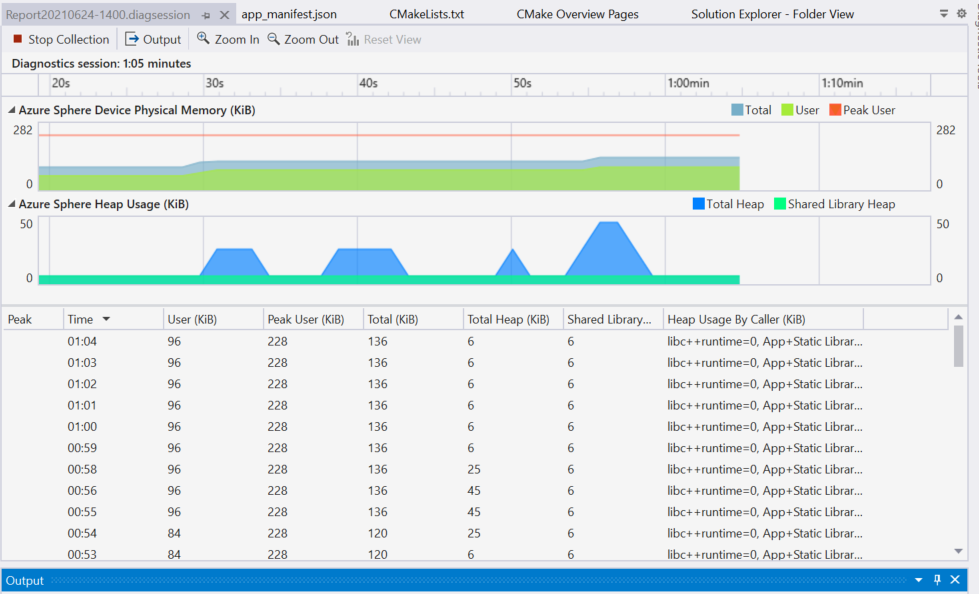
If you have enabled heap memory allocation tracking and your application is not running under the debugger, you will see an additional graph showing heap memory statistics:
- Total Heap: The total heap memory allocated by or on behalf of your application, including from static and dynamic libraries.
- Shared Library Heap: Allocations from dynamically linked libraries provided by the Azure Sphere OS.
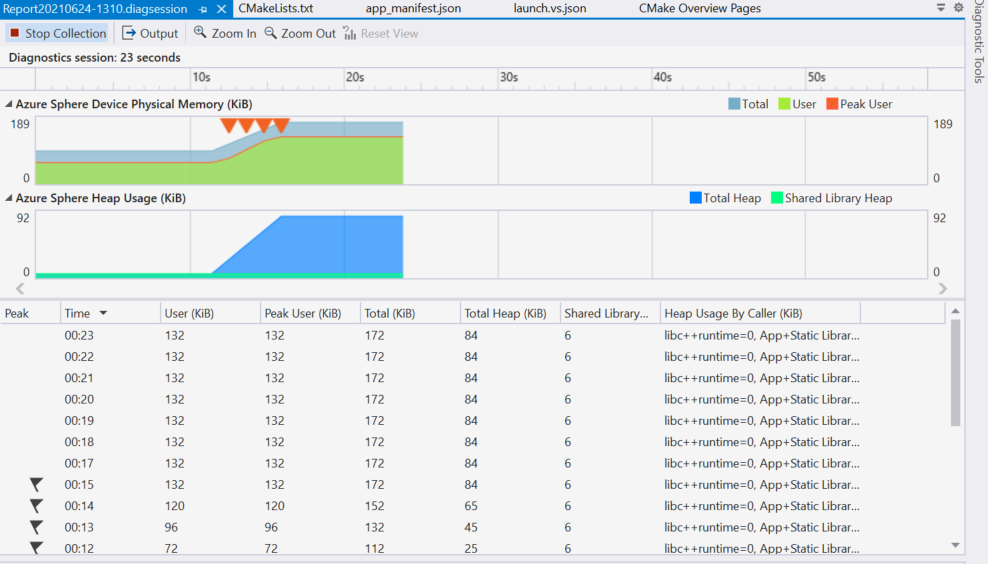
Above the graphs, a timeline view displays your app's run time, correlated with the data on the graph below. Use Zoom In and Zoom Out to focus on specific periods of time.
Below the graphs, a table view displays the same memory statistics and events.
Tip
To copy data from the table to the clipboard, press Ctrl+A to select all rows and then press Ctrl+C.
The first two graphs shown in this section were taken while running Stage 1 of the Memory Usage tutorial, which contains a memory leak. The memory usage climbs monotonically in each graph, providing visual evidence for the leak. When the leak is fixed, as in Stage 2 of the Memory Usage tutorial, the graph rises and falls as memory is allocated and deallocated.
View statistics on total memory usage
The az sphere device app show-memory-stats command returns memory usage statistics on total memory usage, user mode usage, and peak user-mode usage for applications running on an attached device. The device must have the appDevelopment device capability configured to run this command.
The RAM usage statistics displayed while your app is running are:
- Total (Kernel + User Mode): The total physical memory usage of your app on the system, including kernel allocations (such as buffers for sockets) on behalf of your app or the debugging server.
- User Mode: The amount of physical memory used directly by your app, the memory used by any libraries on its behalf (also referred to as anon allocations), and memory used by the debugging server.
- Peak User Mode: The maximum amount of user memory used in the current session. When testing memory usage of your application, you should ensure this value never exceeds 256 KiB. Additional memory is reserved for kernel allocations. This value resets whenever your app restarts or is redeployed.
If you have enabled heap memory allocation tracking and your application is not running under the debugger, you will see additional lines of heap memory statistics:
- Heap: App + Static Libraries: The kernel and user allocations from your code and any libraries statically linked to it.
- Heap: <dynamic library allocations>: Allocations from individual dynamically linked libraries provided by the Azure Sphere OS.
Continuous monitoring of memory usage
To monitor memory usage over time you can use scripts to run the [az sphere device app show-memory-stats](../reference/az sphere-device.md) command in a loop as described in the following examples:
Windows Command Prompt
Using Notepad or another text editor, create a batch script file memuse.bat with the following content:
@echo off

:loop
call az sphere device app show-memory-stats
choice /d y /t 1 > nul
goto loop
Run the batch script by typing its name at the command prompt (or the full path to the file, if it is not in the current directory):
C:\Users\username> memuse.bat
 -------------------------- -------------
 Name                       Usage (bytes)
 ========================================
 Total (Kernel + User Mode) 65536
 -------------------------- -------------
 User Mode                  36864
 -------------------------- -------------
 Peak User Mode             36864
 -------------------------- -------------
 -------------------------- -------------
 Name                       Usage (bytes)
 ========================================
 Total (Kernel + User Mode) 65536
 -------------------------- -------------
 User Mode                  36864
 -------------------------- -------------
 Peak User Mode             36864
 -------------------------- -------------
To exit the script, type Ctrl+C in the Command Prompt window, then answer Y to the "Terminate batch job?" prompt.
Windows PowerShell
while ($true) {
    az sphere device app show-memory-stats
    Start-Sleep -Seconds 1
}
Memory usage and the debugger
When running your app under the debugger, the reported memory statistics also include the memory usage of the debugging server process and other additional memory usage caused by debugging, such as setting breakpoints. For this reason, you should always run your app without debugging when trying to collect accurate memory statistics.
However, using the memory usage profiler can be useful if you run your app with the debugger. Setting breakpoints and stepping through lines of code while observing relative changes in memory consumption can be a useful technique for identifying the causes of memory usage spikes or memory leaks.
When debugging in Visual Studio, the Performance Profiler opens automatically, but does not display heap memory allocation tracking.