Note
Access to this page requires authorization. You can try signing in or changing directories.
Access to this page requires authorization. You can try changing directories.
In this tutorial, you learn how to:
- Create a Log Analytics workspace
- Configure diagnostic settings to integrate sign-in logs with the Log Analytics workspace
- Run queries using the Kusto Query Language (KQL)
Prerequisites
To analyze activity logs with Log Analytics, you need the following roles and requirements:
The appropriate role for Azure Monitor:
- Monitoring Reader
- Log Analytics Reader
- Monitoring Contributor
- Log Analytics Contributor
The appropriate role for Microsoft Entra ID:
- Reports Reader
- Security Reader
- Global Reader
- Security Administrator
Create a Log Analytics workspace
In this step, you create a Log Analytics workspace, which is where you eventually send your sign-in logs. Before you can create the workspace, you need an Azure resource group.
Sign in to the Azure portal as at least a Security Administrator with Log Analytics Contributor permissions.
Browse to Log Analytics workspaces.
Select Create.

On the Create Log Analytics workspace page, perform the following steps:
Select your subscription.
Select a resource group.
Give your workspace a name.
Select your region.

Select Review + Create.
Select Create and wait for the deployment. You might need to refresh the page to see the new workspace.
Configure diagnostic settings
To send your identity log information to your new workspace, you need to configure diagnostic settings. There are different diagnostic settings options for Azure and Microsoft Entra, so for the next set of steps let's switch to the Microsoft Entra admin center to make sure everything is identity related.
Sign in to the Microsoft Entra admin center as at least a Security Administrator.
Browse to Entra ID > Monitoring & health > Diagnostic settings.
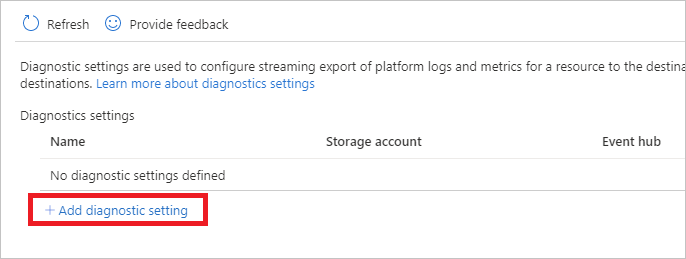
Select Add diagnostic setting.
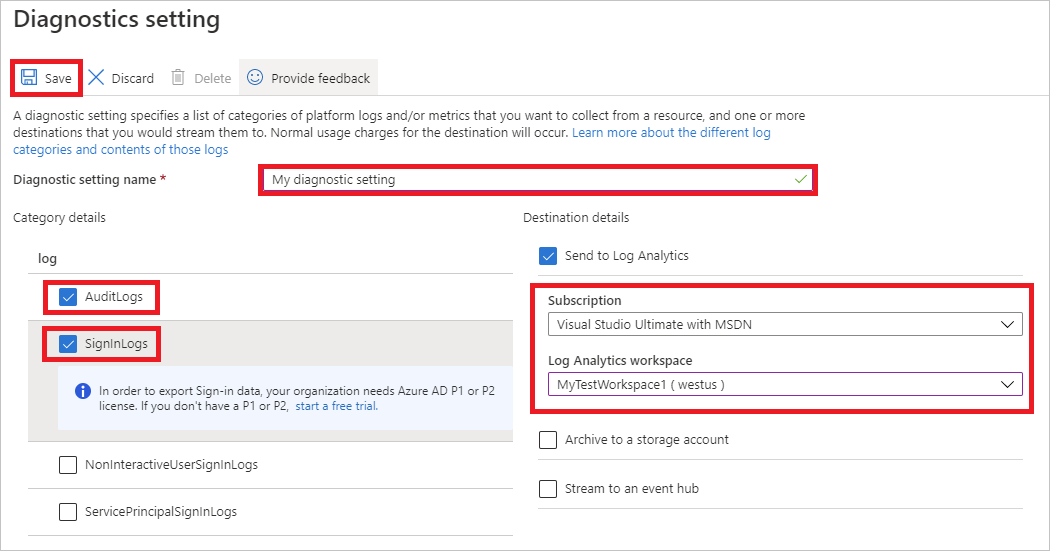
On the Diagnostic setting page, perform the following steps:
Provide a name for the diagnostic setting.
Under Logs, select AuditLogs and SigninLogs.
Under Destination details, select Send to Log Analytics, and then select your new log analytics workspace.
Select Save.
Your selected logs might take up to 15 minutes for the logs to populate in your Log Analytics workspace.
Run queries in Log Analytics
With your logs streaming to your Log Analytics workspace, you can run queries using the Kusto Query Language (KQL). The least privileged role to run queries is the Reports Reader role
Browse to Entra ID > Monitoring & health > Log Analytics.
In the Search textbox, type your query, and select Run.
Kusto query examples
Take 10 random entries from the input data:
SigninLogs | take 10
Look at the sign-ins where the Conditional Access was a success:
SigninLogs | where ConditionalAccessStatus == "success" | project UserDisplayName, ConditionalAccessStatus
Count number of successes:
SigninLogs | where ConditionalAccessStatus == "success" | project UserDisplayName, ConditionalAccessStatus | count
Aggregate count of successful sign-ins by user by day:
SigninLogs | where ConditionalAccessStatus == "success" | summarize SuccessfulSign-ins = count() by UserDisplayName, bin(TimeGenerated, 1d)
View how many times a user does a certain operation in specific time period:
AuditLogs | where TimeGenerated > ago(30d) | where OperationName contains "Add member to role" | summarize count() by OperationName, Identity
Pivot the results on operation name:
AuditLogs | where TimeGenerated > ago(30d) | where OperationName contains "Add member to role" | project OperationName, Identity | evaluate pivot(OperationName)
Merge together Audit and Sign in Logs using an inner join:
AuditLogs |where OperationName contains "Add User" |extend UserPrincipalName = tostring(TargetResources[0].userPrincipalName) | |project TimeGenerated, UserPrincipalName |join kind = inner (SigninLogs) on UserPrincipalName |summarize arg_min(TimeGenerated, *) by UserPrincipalName |extend SigninDate = TimeGenerated
View number of signs ins by client app type:
SigninLogs | summarize count() by ClientAppUsed
Count the sign ins by day:
SigninLogs | summarize NumberOfEntries=count() by bin(TimeGenerated, 1d)
Take five random entries and project the columns you wish to see in the results:
SigninLogs | take 5 | project ClientAppUsed, Identity, ConditionalAccessStatus, Status, TimeGenerated
Take the top 5 in descending order and project the columns you wish to see:
SigninLogs | take 5 | project ClientAppUsed, Identity, ConditionalAccessStatus, Status, TimeGenerated
Create a new column by combining the values to two other columns:
SigninLogs | limit 10 | extend RiskUser = strcat(RiskDetail, "-", Identity) | project RiskUser, ClientAppUsed