Note
Access to this page requires authorization. You can try signing in or changing directories.
Access to this page requires authorization. You can try changing directories.
In this article, you learn how to autoscale GPU workloads on Azure Kubernetes Service (AKS) by using GPU metrics collected by the NVIDIA Data Center GPU Manager (DCGM) exporter. These metrics are exposed through Azure Managed Prometheus and consumed by Kubernetes Event-Driven Autoscaling (KEDA) to automatically scale workloads based on real-time GPU utilization. This solution helps optimize GPU resource usage and control operational costs by dynamically adjusting application scale in response to workload demand.
Prerequisites
- Azure CLI version 2.60.0 or later. Run
az --versionto find the version. If you need to install or upgrade, see Install Azure CLI. - Helm version 3.17.0 or later installed.
- kubectl version 1.28.9 or later installed.
- NVIDIA GPU quota in your Azure subscription. This example uses the
Standard_NC40ads_H100_v5SKU, but other NVIDIA H100 VM SKUs are also supported.
Before proceeding, ensure your AKS cluster is configured with the following:
- Integrate KEDA with your Azure Kubernetes Service cluster.
- Monitor GPU metrics from NVIDIA DCGM exporter with Azure Managed Prometheus and Azure Managed Grafana.
At this point, you should have:
- An AKS cluster with NVIDIA GPU-enabled node pool(s), and GPUs confirmed as schedulable.
- Azure Managed Prometheus and Grafana enabled on your AKS cluster. KEDA enabled on your cluster.
- The User Assigned Managed Identity used by KEDA assigned the
Monitoring Data Readerrole scoped to the Azure Monitor Workspace associated with your AKS cluster.
Create a new KEDA scaler using the NVIDIA DCGM Exporter metrics
To create a KEDA scaler, you need two components:
- The Prometheus query endpoint.
- The User Assigned Managed Identity.
Retrieve the Azure Managed Prometheus query endpoint
You can find this value in the Overview section of the Azure Monitor workspace attached to your AKS cluster in the Azure portal.
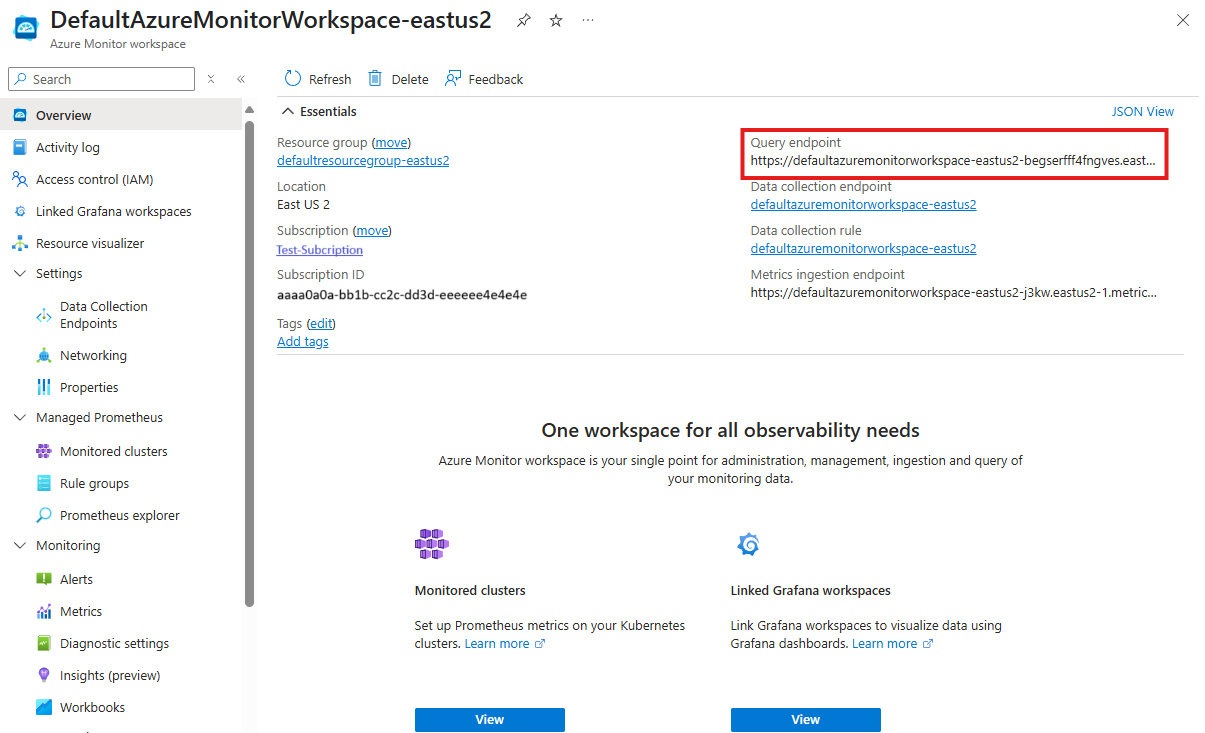
Export the Azure Managed Prometheus query endpoint to an environmental variable:
export PROMETHEUS_QUERY_ENDPOINT="https://example.prometheus.monitor.azure.com"
Retrieve the User Assigned Managed Identity
The User Assigned Managed Identity was previously created following the KEDA integration steps. If needed, reload this value with the az identity show command:
export USER_ASSIGNED_CLIENT_ID="$(az identity show --resource-group $RESOURCE_GROUP --name $USER_ASSIGNED_IDENTITY_NAME --query 'clientId' -o tsv)"
Create the KEDA scaler manifest
This manifest creates the TriggerAuthentication and ScaledObject for autoscaling based on GPU utilization measured by the DCGM_FI_DEV_GPU_UTIL metric.
Note
This example uses the DCGM_FI_DEV_GPU_UTIL metric, which measures GPU utilization. Other metrics are also available from the DCGM exporter depending on your workload requirements. For a complete list of available metrics, refer to the NVIDIA DCGM Exporter documentation.
| Field | Description |
|---|---|
metricName |
Specifies the GPU metric to monitor. DCGM_FI_DEV_GPU_UTIL reports the percentage of time the GPU is actively processing workloads. This value typically ranges from 0 to 100. |
query |
PromQL query that calculates the average GPU utilization across all pods in the deployment my-gpu-workload. This ensures scaling decisions are based on overall GPU usage, not a single pod. |
threshold |
The target average GPU utilization percentage that triggers scaling. If the average exceeds 5%, the scaler increases the number of pod replicas. |
activationThreshold |
The minimum average GPU utilization required to activate scaling. If the utilization is below 2%, scaling actions will not occur, preventing unnecessary scaling during low activity periods. |
Create the following KEDA manifest:
cat <<EOF > keda-gpu-scaler-prometheus.yaml
apiVersion: keda.sh/v1alpha1
kind: TriggerAuthentication
metadata:
  name: azure-managed-prometheus-trigger-auth
spec:
  podIdentity:
    provider: azure-workload
    identityId: ${USER_ASSIGNED_CLIENT_ID}
---
apiVersion: keda.sh/v1alpha1
kind: ScaledObject
metadata:
  name: my-gpu-workload
spec:
  scaleTargetRef:
    name: my-gpu-workload
  minReplicaCount: 1
  maxReplicaCount: 20
  triggers:
    - type: prometheus
      metadata:
        serverAddress: ${PROMETHEUS_QUERY_ENDPOINT}
        metricName: DCGM_FI_DEV_GPU_UTIL
        query: avg(DCGM_FI_DEV_GPU_UTIL{deployment="my-gpu-workload"})
        threshold: '5'
        activationThreshold: '2'
      authenticationRef:
        name: azure-managed-prometheus-trigger-auth
EOF
Apply this manifest using the
kubectl applycommand:kubectl apply -f keda-gpu-scaler-prometheus.yaml
Test the new scaling capabilities
Create a sample workload that consumes GPU resources in your AKS cluster. You can start with the following example:
cat <<EOF > my-gpu-workload.yaml
apiVersion: apps/v1
kind: Deployment
metadata:
  name: my-gpu-workload
  namespace: default
spec:
  replicas: 1
  selector:
    matchLabels:
      app: my-gpu-workload
  template:
    metadata:
      labels:
        app: my-gpu-workload
    spec:
      tolerations:
        - key: "sku"
          operator: "Equal"
          value: "gpu"
          effect: "NoSchedule"
      containers:
        - name: my-gpu-workload
          image: mcr.microsoft.com/azuredocs/samples-tf-mnist-demo:gpu
          command: ["/bin/sh"]
          args: ["-c", "while true; do python /app/main.py --max_steps=500; done"]
          resources:
            limits:
              nvidia.com/gpu: 1
EOF
Apply this deployment manifest using the
kubectl applycommand:kubectl apply -f my-gpu-workload.yamlNote
If no GPU nodes are currently available, the pod will remain in a
Pendingstate until a node is provisioned, showing the following message:Events: Type Reason Age From Message ---- ------ ---- ---- ------- Warning FailedScheduling 3m19s default-scheduler 0/2 nodes are available: 2 Insufficient nvidia.com/gpu. preemption: 0/2 nodes are available: 2 No preemption victims found for incoming pod.The cluster autoscaler will eventually start and provision a new GPU node:
Normal TriggeredScaleUp 2m43s cluster-autoscaler pod triggered scale-up: [{aks-gpunp-36854149-vmss 0->1 (max: 2)}]Note
Depending on the size of your provisioned GPU SKU, node provisioning might take several minutes.
To verify progress, check the Horizontal Pod Autoscaler (HPA) events using the
kubectl describecommand:kubectl describe hpa my-gpu-workloadThe output should look like the following:
Conditions:
  Type            Status  Reason            Message
  ----            ------  ------            -------
  AbleToScale     True    ReadyForNewScale  recommended size matches current size
  ScalingActive   True    ValidMetricFound  the HPA successfully calculated a replica count from external metric s0-prometheus(&LabelSelector{MatchLabels:map[string]string{scaledobject.keda.sh/name: my-gpu-workload}})
  ScalingLimited  True    TooFewReplicas    the desired replica count is less than the minimum replica count
Confirm that the GPU node has been added and the pod is running with the
kubectl getcommand:kubectl get nodesThe output should look like the following:
NAME                                STATUS   ROLES    AGE     VERSION
aks-gpunp-36854149-vmss000005       Ready    <none>   4m36s   v1.31.7
aks-nodepool1-34179260-vmss000002   Ready    <none>   26h     v1.31.7
aks-nodepool1-34179260-vmss000003   Ready    <none>   26h     v1.31.7
Scale down the GPU node pool
To scale down the GPU node pool, delete your workload deployment using the kubectl delete command:
kubectl delete deployment my-gpu-workload
Note
You can configure the node pool to scale down to zero by enabling the cluster autoscaler and setting the min-count to 0 at node pool creation time. For example:
az aks nodepool add \
 --resource-group myResourceGroup \
 --cluster-name myAKSCluster \
 --name gpunp \
 --node-count 1 \
 --node-vm-size Standard_NC40ads_H100_v5 \
 --node-taints sku=gpu:NoSchedule \
 --enable-cluster-autoscaler \
 --min-count 0 \
 --max-count 3
Next steps
- Deploy a multi-instance GPU (MIG) workload on AKS.
- Explore KAITO on AKS for AI inferencing and fine-tuning.
- Learn more about Ray clusters on AKS.
Collaborate with us on GitHub
The source for this content can be found on GitHub, where you can also create and review issues and pull requests. For more information, see our contributor guide.

Azure Kubernetes Service