Note
Access to this page requires authorization. You can try signing in or changing directories.
Access to this page requires authorization. You can try changing directories.
Inspektor Gadget is an observability tool that helps you inspect, trace, and troubleshoot workloads running on your Azure Kubernetes Service (AKS) cluster by using eBPF. It collects low-level system data, such as DNS queries, file access, process execution, and network connections, and correlates it with Kubernetes metadata like pods, namespaces, and nodes. This correlation helps you analyze root causes faster and gain an increased understanding of your system. This correlation makes it easier to diagnose issues that are otherwise difficult to observe in a Kubernetes environment.
The Inspektor Gadget cluster extension installs and manages Inspektor Gadget on your AKS cluster through the Azure resource management plane. You install, configure, update, and remove it by using the az k8s-extension CLI commands. This approach gives you a consistent, Azure Resource Manager-driven lifecycle instead of managing the deployment manually with Helm. All container images for the extension are pulled from Microsoft Artifact Registry (MCR).
Important
AKS preview features are available on a self-service, opt-in basis. Previews are provided "as is" and "as available," and they're excluded from the service-level agreements and limited warranty. AKS previews are partially covered by customer support on a best-effort basis. As such, these features aren't meant for production use. For more information, see the following support articles:
How it works
The extension deploys Inspektor Gadget as a DaemonSet named gadget in the gadget namespace, with one pod on each schedulable node. Each pod loads specific eBPF programs into the kernel to collect data directly from the node for your use case, with minimal overhead.
Inspektor Gadget enriches raw kernel events with Kubernetes metadata. For example, when it traces a DNS query, it correlates the network packet with the pod, namespace, and node that produced it, so you see workload context instead of just IP addresses and process IDs.
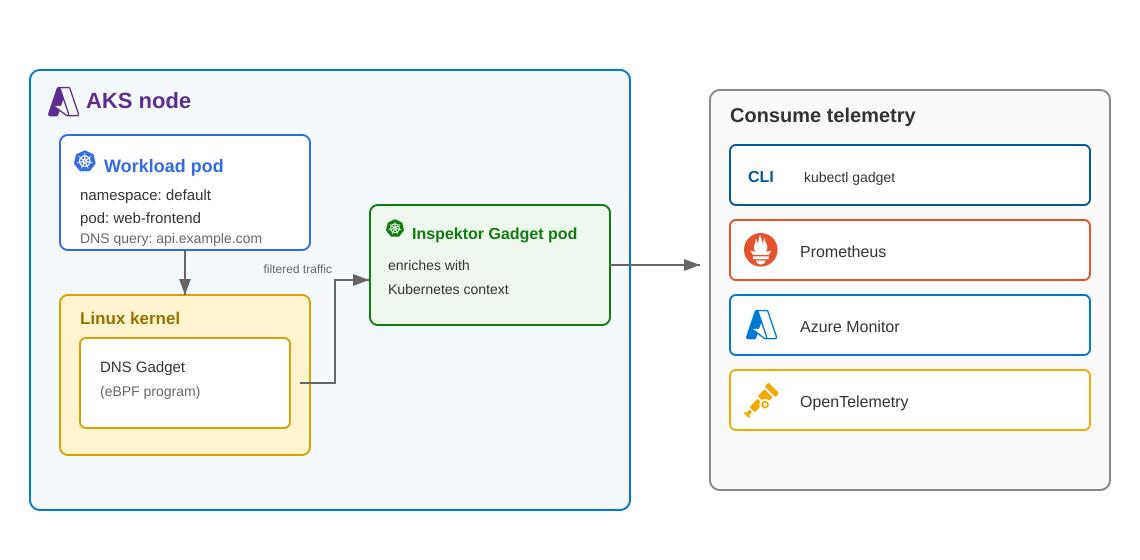
You interact with Inspektor Gadget by running gadgets, which are purpose-built tools that capture a specific kind of system activity. You can use gadgets in two ways: interactively with the kubectl gadget plugin, scoping each gadget to a namespace, a pod, or the entire cluster for ad hoc troubleshooting; or continuously, by starting gadgets at install time so they run in the background and export their data to Prometheus, Azure Monitor, or OpenTelemetry-compatible backends without manual intervention.
What can you do with Inspektor Gadget?
Inspektor Gadget adds workload context to eBPF telemetry. It collects low-level signals from across the kernel and ties them to the Kubernetes objects involved, so you can observe and troubleshoot a range of subsystems:
- DNS: query and response activity, with the originating pod, to diagnose name-resolution failures.
- Networking: TCP connections, dropped packets, and retransmissions for connectivity analysis.
- Process: process execution, signals, and out-of-memory kills to track what runs inside your pods.
- File system: file opens, mounts, and slow filesystem operations to investigate unexpected I/O.
- Security: capability checks, seccomp events, and Linux Security Module decisions to harden workloads.
For the complete list of gadgets, see the Inspektor Gadget gadget catalog.
Consume telemetry
You can consume the telemetry that Inspektor Gadget collects in several ways:
- CLI: run gadgets interactively and view results by using the
kubectl gadgetplugin. - Prometheus: expose gadget metrics in Prometheus format for scraping.
- Azure Monitor: scrape gadget metrics by using Azure Monitor managed Prometheus.
- OpenTelemetry: export metrics to OpenTelemetry-compatible backends.