Note
Access to this page requires authorization. You can try signing in or changing directories.
Access to this page requires authorization. You can try changing directories.
An important part of any Analysis Services solution is monitoring how your servers are performing. For general information about monitoring Azure Analysis Services, see Monitor Azure Analysis Services.
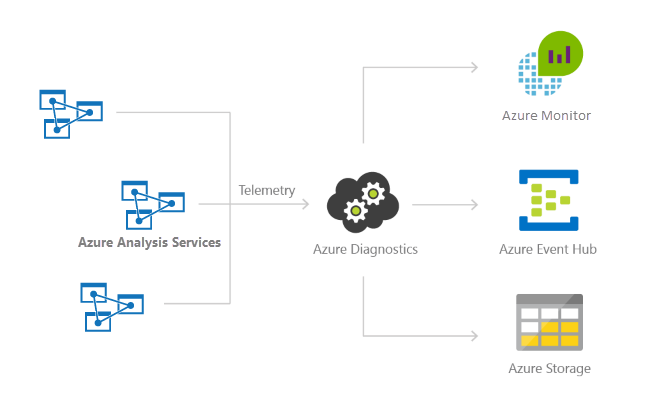
This article describes how to set up, view, and manage Azure Monitor resource logs for your Analysis Services servers. You can send resource logs to Azure Storage, stream them to Azure Event Hubs, and export them to Azure Monitor logs.
Note
We recommend that you use the Azure Az PowerShell module to interact with Azure. To get started, see Install Azure PowerShell. To learn how to migrate to the Az PowerShell module, see Migrate Azure PowerShell from AzureRM to Az.
What's logged?
You can select Engine, Service, and Metrics log categories. For a listing of what's logged for each category, see Supported resource logs for Microsoft.AnalysisServices/servers.
Set up diagnostic settings
To learn how to set up diagnostic settings using the Azure portal, Azure CLI, PowerShell, or Azure Resource Manager, see Create diagnostic settings in Azure Monitor.
Manage your logs
Logs are typically available within a couple hours of setting up logging. It's up to you to manage your logs in your storage account:
- Use standard Azure access control methods to secure your logs by restricting who can access them.
- Delete logs that you no longer want to keep in your storage account.
- Be sure to set a retention period for so old logs are deleted from your storage account.
View logs in Log Analytics workspace
To view your diagnostic data, in Log Analytics workspace, open Logs from the left menu.
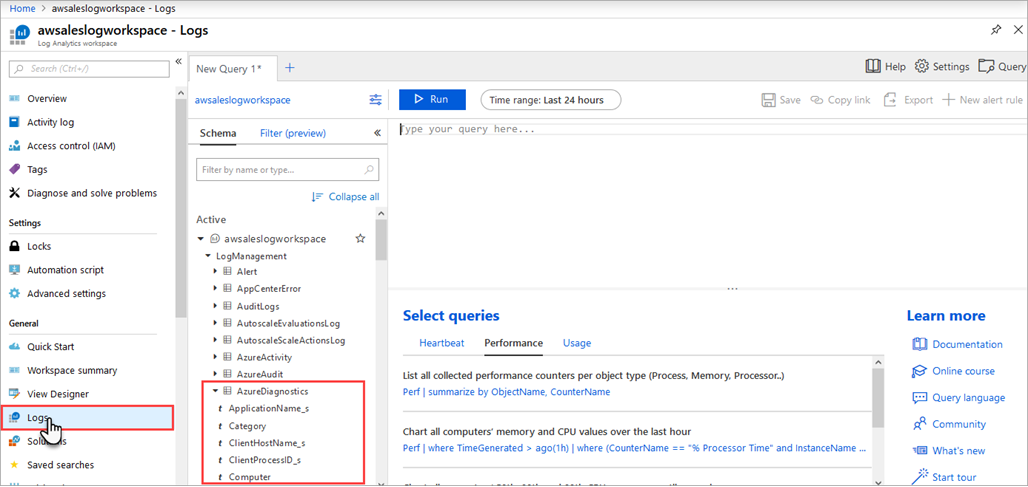
In the query builder, expand LogManagement > AzureDiagnostics. AzureDiagnostics includes Engine and Service events. Notice a query is created on-the-fly. The EventClass_s field contains xEvent names, which may look familiar if you've used xEvents for on-premises logging. Click EventClass_s or one of the event names and Log Analytics workspace continues constructing a query. Be sure to save your queries to reuse later.
For more queries you can use with Analysis Services, see Sample Kusto queries.
Turn on logging by using PowerShell
In this quick tutorial, you create a storage account in the same subscription and resource group as your Analysis Service server. You then use Set-AzDiagnosticSetting to turn on diagnostics logging, sending output to the new storage account.
Prerequisites
To complete this tutorial, you must have the following resources:
- An existing Azure Analysis Services server. For instructions on creating a server resource, see Create a server in Azure portal, or Create an Azure Analysis Services server by using PowerShell.
Connect to your subscriptions
Start an Azure PowerShell session and sign in to your Azure account with the following command:
Connect-AzAccount
In the pop-up browser window, enter your Azure account user name and password. Azure PowerShell gets all the subscriptions that are associated with this account and by default, uses the first one.
If you have multiple subscriptions, you might have to specify a specific one that was used to create your Azure Key Vault. Type the following to see the subscriptions for your account:
Get-AzSubscription
Then, to specify the subscription that's associated with the Azure Analysis Services account you are logging, type:
Set-AzContext -SubscriptionId <subscription ID>
Note
If you have multiple subscriptions associated with your account, it is important to specify the subscription.
Create a new storage account for your logs
You can use an existing storage account for your logs, provided it's in the same subscription as your server. For this tutorial, you create a new storage account dedicated to Analysis Services logs. To make it easy, you're storing the storage account details in a variable named sa.
You also use the same resource group as the one that contains your Analysis Services server. Substitute values for awsales_resgroup, awsaleslogs, and West Central US with your own values:
$sa = New-AzStorageAccount -ResourceGroupName awsales_resgroup `
-Name awsaleslogs -Type Standard_LRS -Location 'West Central US'
Identify the server account for your logs
Set the account name to a variable named account, where ResourceName is the name of the account.
$account = Get-AzResource -ResourceGroupName awsales_resgroup `
-ResourceName awsales -ResourceType "Microsoft.AnalysisServices/servers"
Enable logging
To enable logging, use the Set-AzDiagnosticSetting cmdlet together with the variables for the new storage account, server account, and the category. Run the following command, setting the -Enabled flag to $true:
Set-AzDiagnosticSetting -ResourceId $account.ResourceId -StorageAccountId $sa.Id -Enabled $true -Categories Engine
The output should look something like this example:
StorageAccountId            :
/subscriptions/aaaa0a0a-bb1b-cc2c-dd3d-eeeeee4e4e4e/resourceGroups/awsales_resgroup/providers/Microsoft.Storage/storageAccounts/awsaleslogs
ServiceBusRuleId            :
EventHubAuthorizationRuleId :
Metrics
    TimeGrain       : PT1M
    Enabled         : False
    RetentionPolicy
    Enabled : False
    Days    : 0


Logs
    Category        : Engine
    Enabled         : True
    RetentionPolicy
    Enabled : False
    Days    : 0


    Category        : Service
    Enabled         : False
    RetentionPolicy
    Enabled : False
    Days    : 0


WorkspaceId                 :
Id                          : /subscriptions/aaaa0a0a-bb1b-cc2c-dd3d-eeeeee4e4e4e/resourcegroups/awsales_resgroup/providers/microsoft.analysisservic
es/servers/awsales/providers/microsoft.insights/diagnosticSettings/service
Name                        : service
Type                        :
Location                    :
Tags                        :
This output confirms that logging is now enabled for the server, saving information to the storage account.
You can also set retention policy for your logs so older logs are automatically deleted. For example, set retention policy using -RetentionEnabled flag to $true, and set -RetentionInDays parameter to 90. Logs older than 90 days are automatically deleted.
Set-AzDiagnosticSetting -ResourceId $account.ResourceId`
 -StorageAccountId $sa.Id -Enabled $true -Categories Engine`
  -RetentionEnabled $true -RetentionInDays 90
Next steps
- Learn more about Azure Monitor resource logging.
- See Set-AzDiagnosticSetting in PowerShell help.