Note
Access to this page requires authorization. You can try signing in or changing directories.
Access to this page requires authorization. You can try changing directories.
APPLIES TO: All API Management tiers
This article explains how to use the Azure API Management Extension for Visual Studio Code to create, understand, and debug Azure API Management policies with AI assistance from GitHub Copilot for Azure.
Azure API Management policies are a sequence of statements that address cross-cutting concerns like authentication, authorization, throttling, caching, and transformation, applied to API requests or responses.
Prerequisites
Visual Studio Code and the latest version of Azure API Management Extension for Visual Studio Code.
The following extensions are needed for the specified scenarios:
- GitHub Copilot for Azure extension - to create and explain policies
- REST Client extension - for policy debugging
An API Management instance. If you need to create one, see this quickstart.
Import an API to your API Management instance. For example steps, see Tutorial: Use the API Management Extension for Visual Studio Code to import and manage APIs.
Restrictions and limitations
Policy debugging is currently supported only in the API Management Developer tier.
Policy debugging uses the built-in (service-level) all-access subscription (display name "Built-in all-access subscription"). You must be a service owner to use this subscription.
Create a policy using GitHub Copilot for Azure
The Azure API Management extension integrates with GitHub Copilot for Azure to help you create a draft of a policy. With AI assistance, create and edit policies in a user-friendly way.
To create a policy:
Open the API Management extension in Visual Studio Code.
Select the API Management instance you want to work with.
Select the policy scope that you want to work with.
- To create a policy that applies to all APIs in the instance, select Global Policy.
- To create a policy that applies to a specific API, under APIs, select the API, and then select Policy.
- To create a policy that applies to a specific API operation, select the operation, and then select Policy.
Open Chat.
In the Chat window, enter a prompt in natural language to create a policy. Examples:
@azure I want to limit requests to 100 calls per minute@azure Create a policy that sets the backend URL to https://mybackend.contoso.com and adds a custom header to the requestCopilot generates a policy draft in the Chat window. You can refine the prompt if you want Copilot to change the output.
When you're ready, select the Copy button to copy the policy to the clipboard, or select Apply in Editor to insert the policy in the editor window. If you are satisfied with the change in the policy XML, select Keep.
Tip
Check in the Problems window for explanation of any issues in the policy XML.
Explain a policy using GitHub Copilot for Azure
Copilot can help explain an existing policy in your API Management instance.
To receive an explanation:
Open the API Management extension in Visual Studio Code.
Select the API Management instance you want to work with.
Select the policy scope that you want to work with.
- To explain a policy that applies to all APIs in the instance, select Global Policy.
- To explain a policy that applies to a specific API, under APIs, select the API, and then select Policy.
- To explain a policy that applies to a specific API operation, select the operation, and then select Policy.
In the policy editor window that appears, right-click and select Explain.
An overview and explanation of policies in the policy XML document are generated in the Chat window.
Debug policies using the VS Code extension
The Azure API Management extension for Visual Studio Code provides a debugging experience that allows you to step through the policy pipeline or set a breakpoint when you send a request to the gateway.
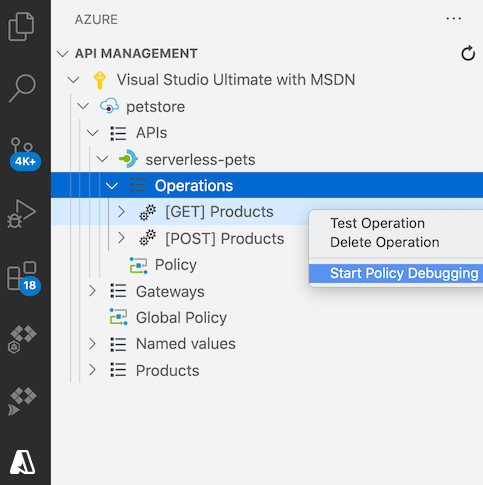
Initiate a debugging session
- Open the API Management extension in Visual Studio Code.
- Select the API Management instance to debug.
- Select the API and operation to debug.
- Right click on the operation and select Start Policy Debugging.
At this point, the extension starts to establish a debugging session with the API Management gateway. Check the progress in the Debug Console window.
Note
Starting a debugging session also enables request tracing for the duration of the session, to help you diagnose and solve issues.
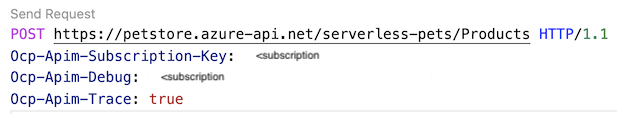
Send a test request
When the debugging session is established, the REST Client extension opens a new editor that allows you to create and send a test HTTP request to the gateway.
The Ocp-Apim-Debug header is added automatically to the request. This header is required and the value must be set to the service-level, all-access subscription key to trigger the debugging functionality in the API Management gateway.
Modify the HTTP request in the editor according to your test scenario. Then click Send Request to send the test request to the API Management gateway.
Debug policies
After the test HTTP request is sent, the extension opens the debugging window, which shows the effective policies of this operation and stops at the first effective policy.
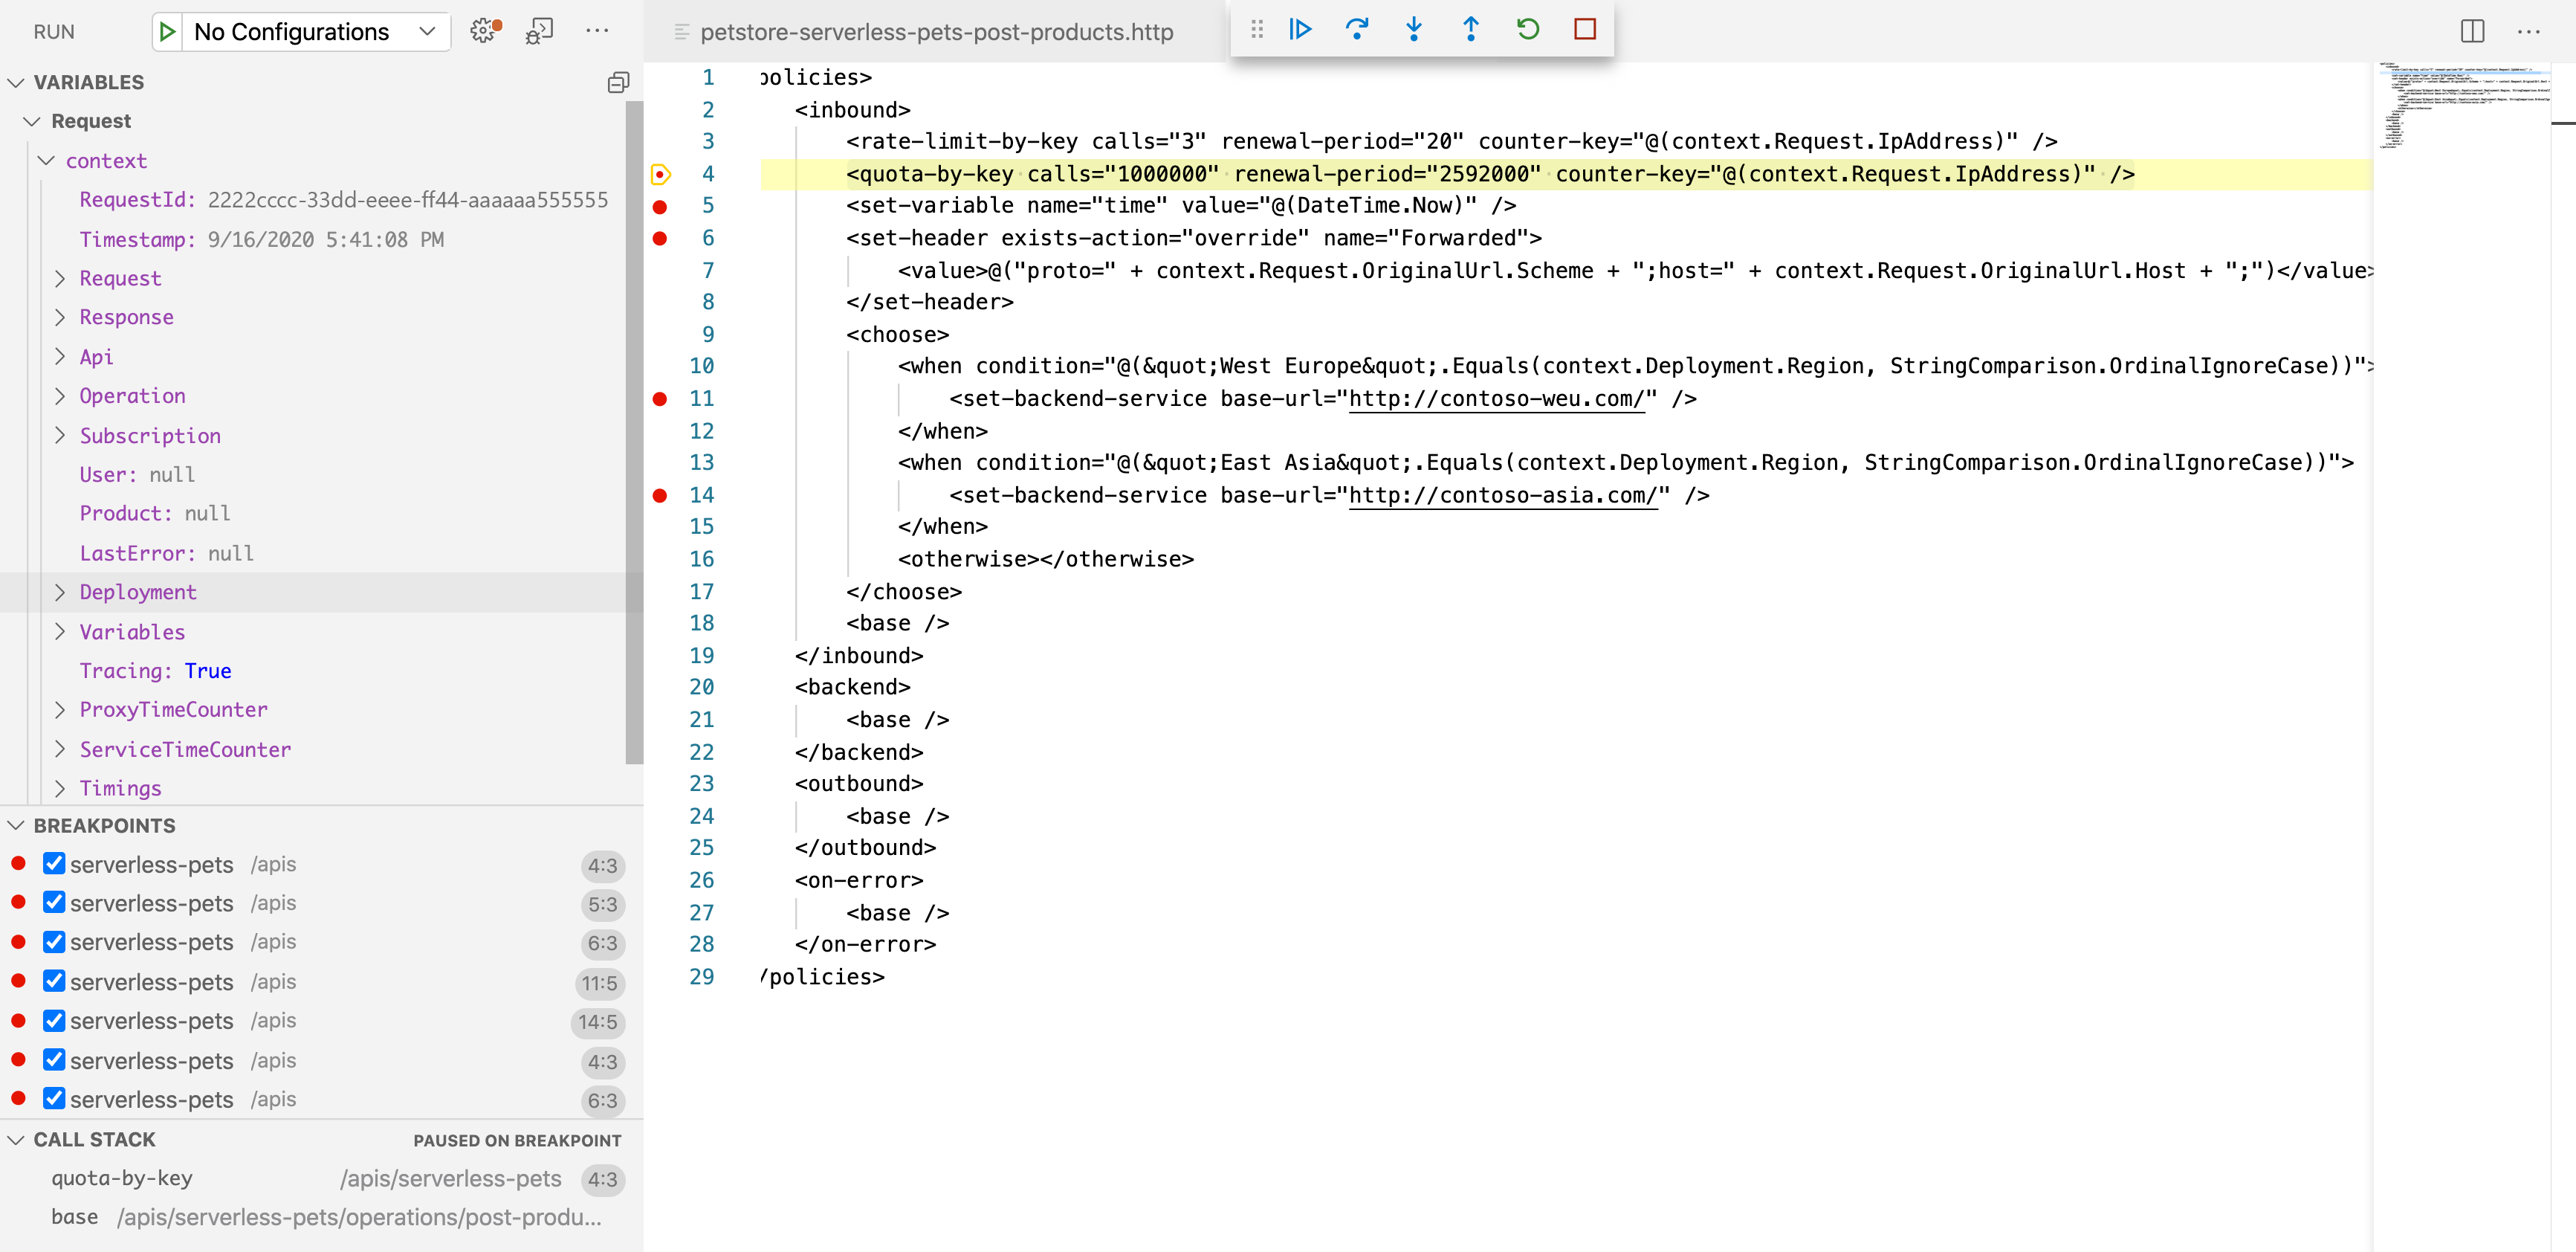
To follow the policy pipeline, you can single-step through individual policies or set a breakpoint at a policy and step directly to that policy.
- In the Variables panel, inspect values of system-created and user-created variables.
- In the Breakpoints panel, view the list of all breakpoints that have been set.
- In the Call Stack panel, view the current effective policy scope.
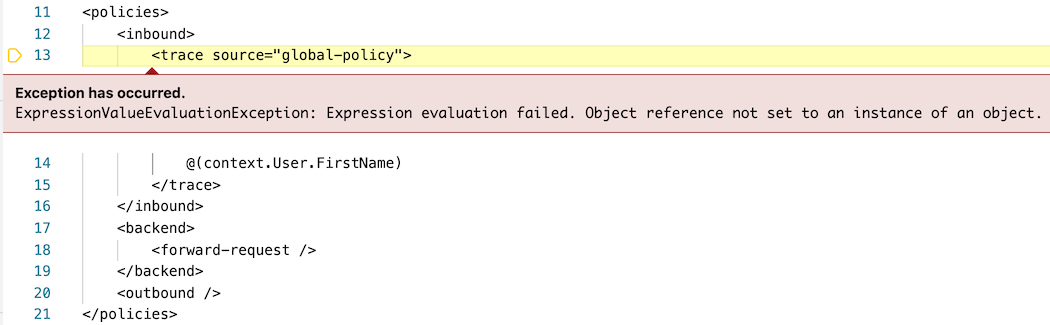
If there is an error during policy execution, you will see the details of the error at the policy where it happened.
Exit the debugging session by clicking the Stop button when you are finished.
Tip
To review the request trace, select the value of the Ocp-Apim-Trace-Location header that is provided in the HTTP response.
Related content
- Learn more about the API Management extension for Visual Studio Code.
- Report issues in the GitHub repository