Note
Access to this page requires authorization. You can try signing in or changing directories.
Access to this page requires authorization. You can try changing directories.
APPLIES TO: Consumption | Developer | Basic | Standard | Premium
When you build and manage an API in Azure API Management, you want to be prepared for any issues that might arise, from 404 not found errors to a 502 bad gateway error. API Management Diagnostics is an intelligent and interactive experience that helps you troubleshoot your APIs published in API Management with no configuration required. When you run into issues with your published APIs, API Management Diagnostics points out what's wrong, and guides you to the right information to quickly troubleshoot and resolve the issue.
Although this experience is most helpful for issues that occurred with your API within the last 24 hours, all the diagnostic graphs are always available for you to analyze.
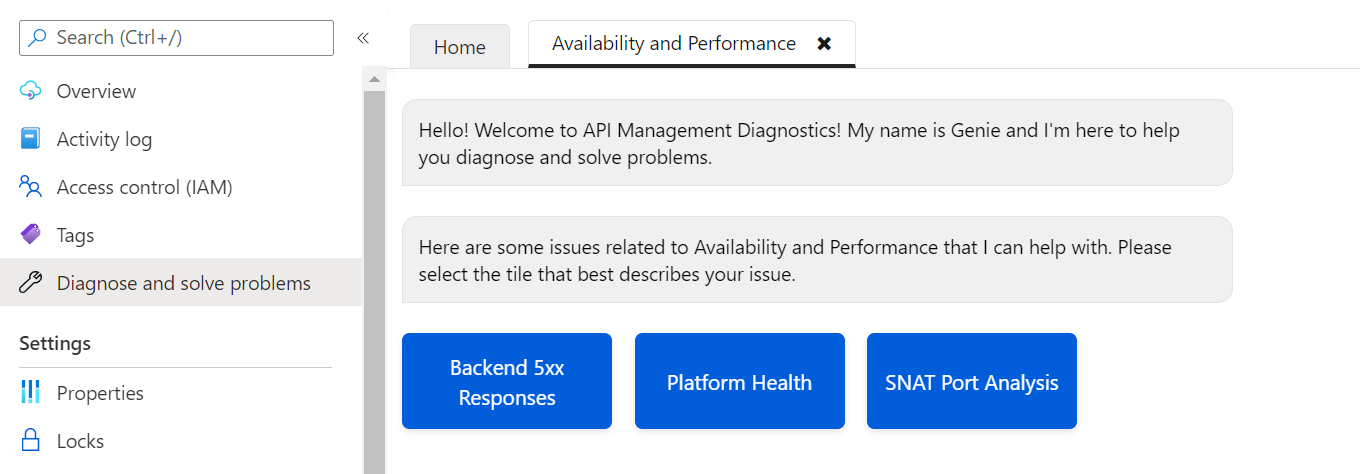
Open API Management Diagnostics
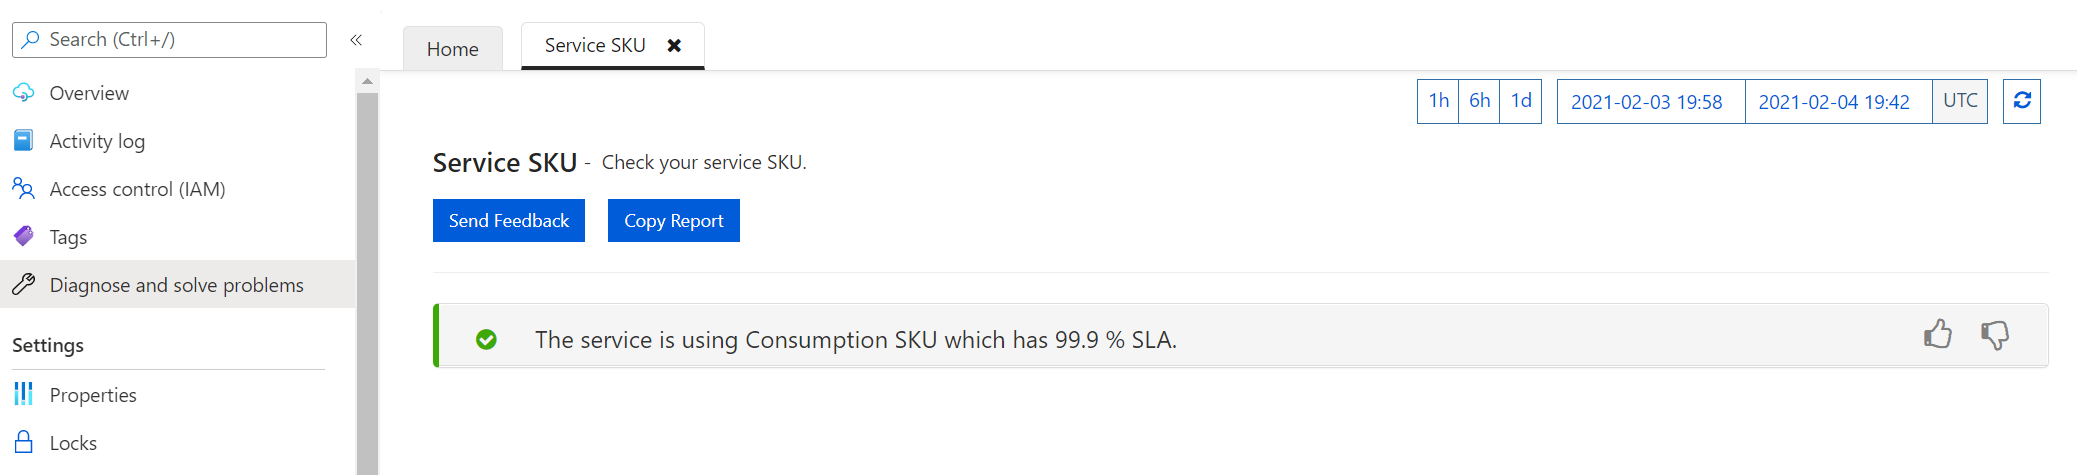
To access API Management Diagnostics, navigate to your API Management service instance in the Azure portal. In the sidebar menu, select Diagnose and solve problems.
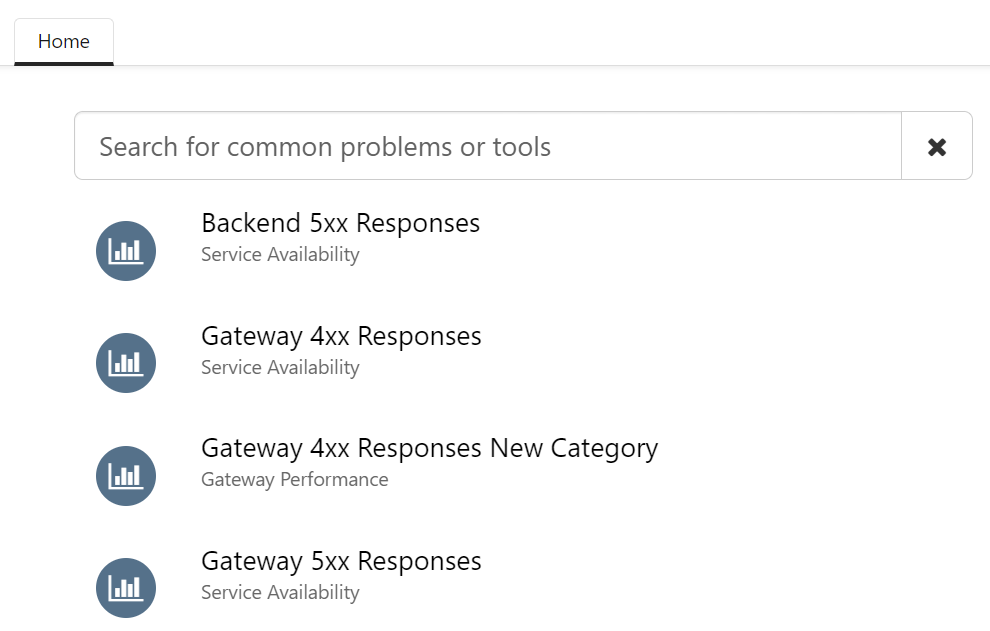
Intelligent search
You can search for issues or problems in the search bar at the top of the page. The search also helps you find the tools to help troubleshoot or resolve your issues.
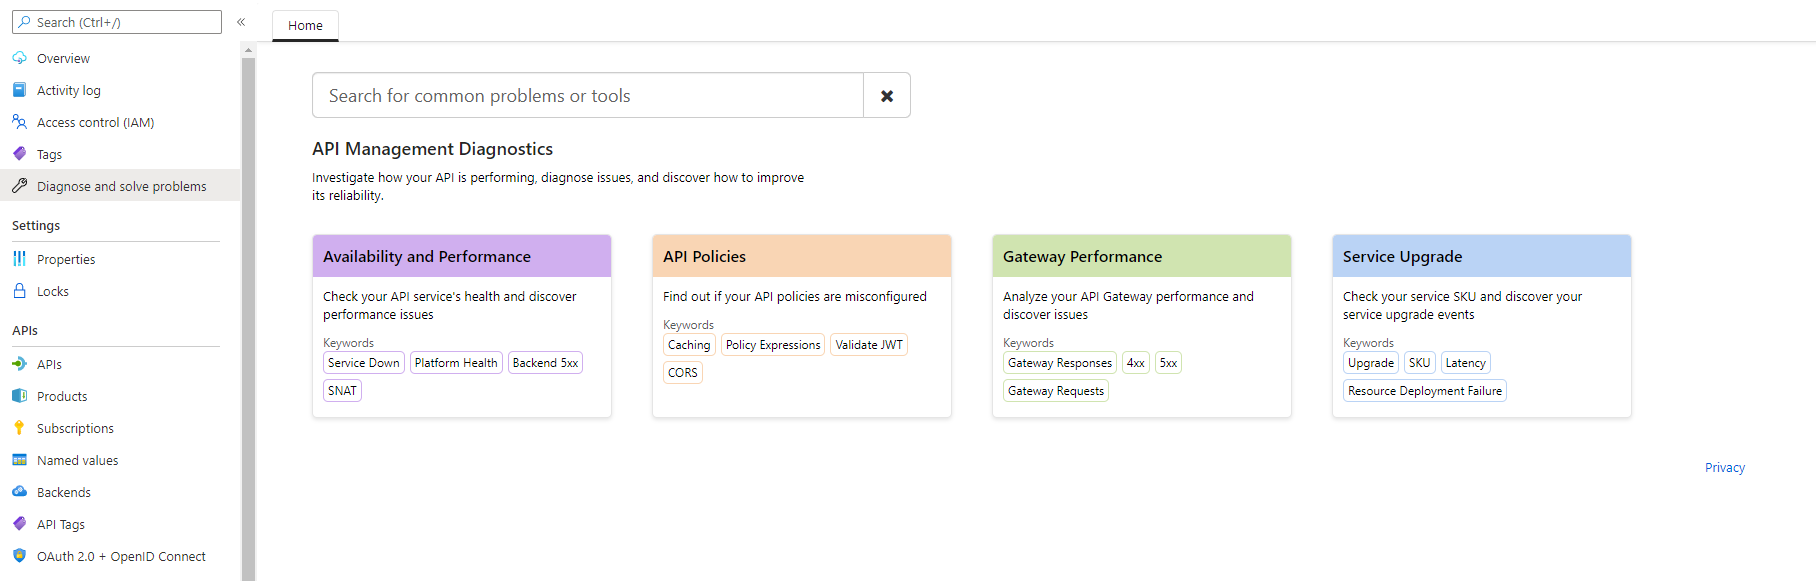
Troubleshooting categories
You can troubleshoot issues by category. Common issues that are related to your API performance, gateway, API policies, and service tier can all be analyzed within each category. Each category also provides more specific diagnostics checks.
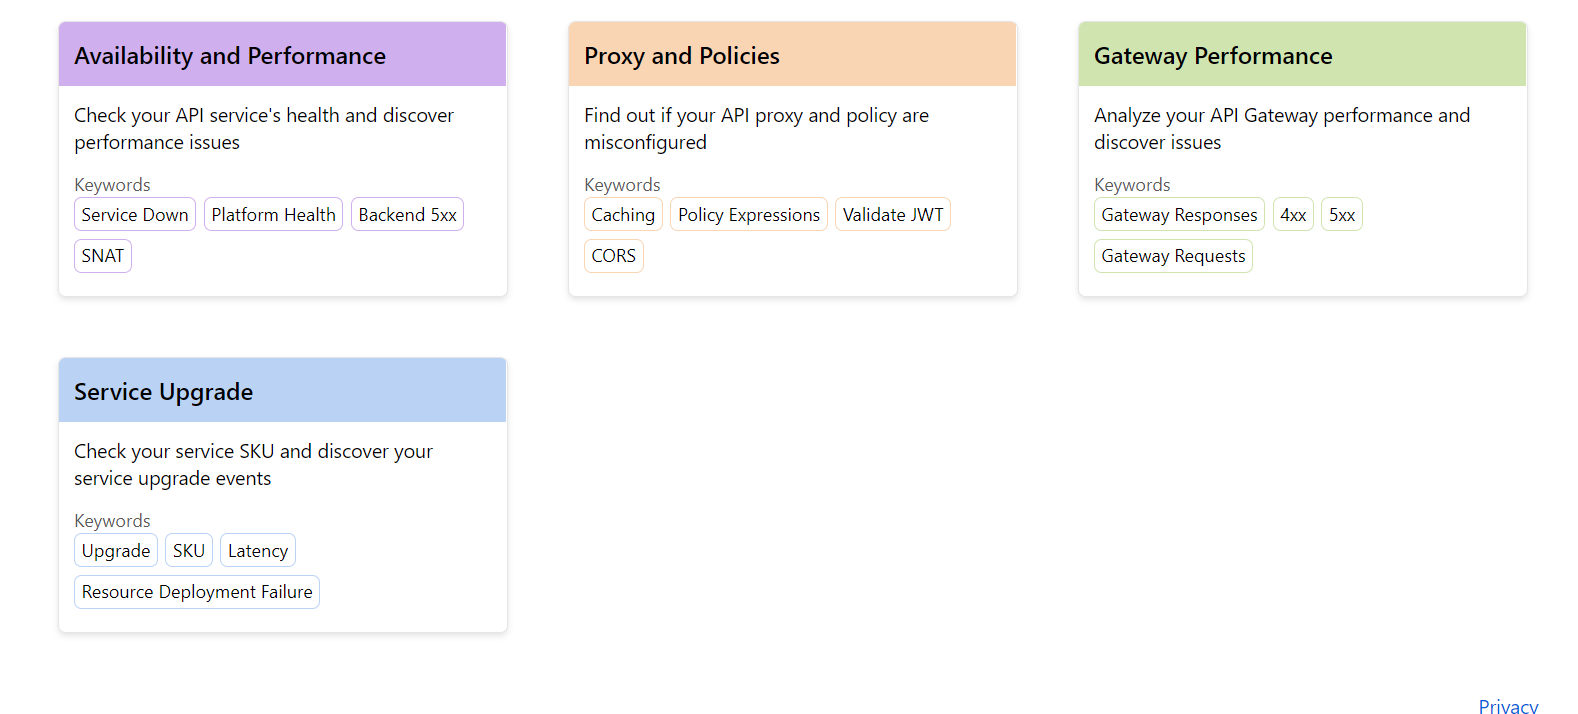
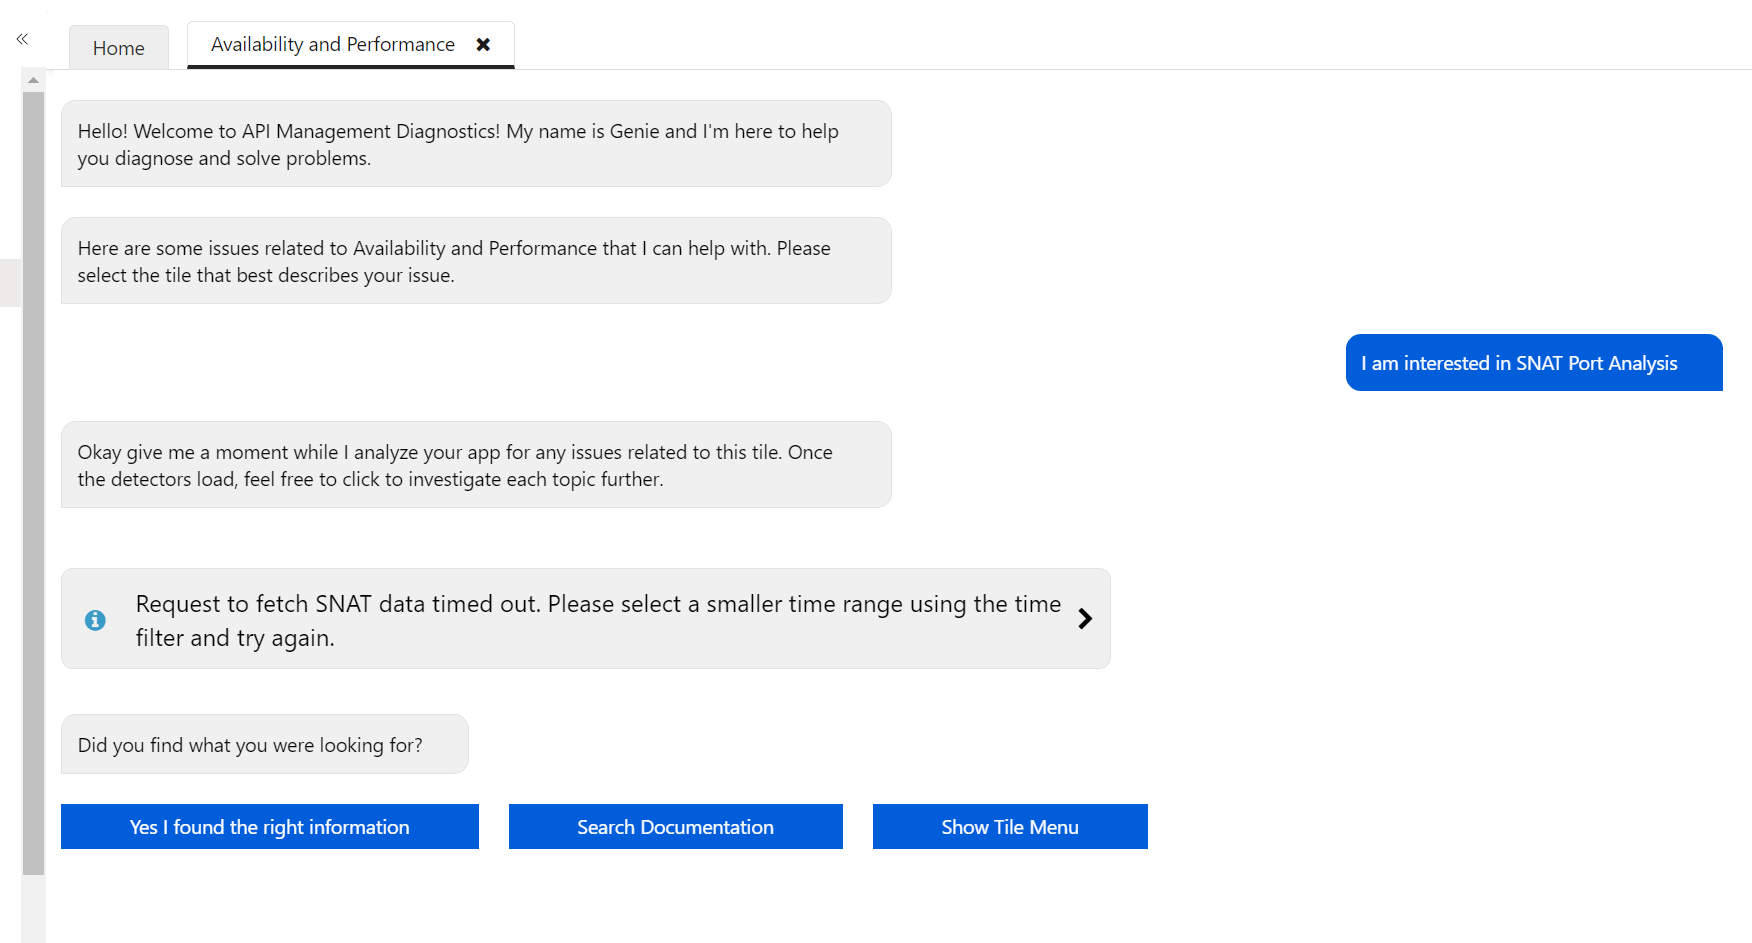
Availability and performance
Check your API availability and performance issues under this category. Selecting this category tile shows a few common checks that are recommended. Select each item to dive deep to the specifics of each issue. The check also provides you with a graph showing your API performance and a summary of performance issues. For example, your API service might have had a 5xx error and timeout in the last hour at the backend.
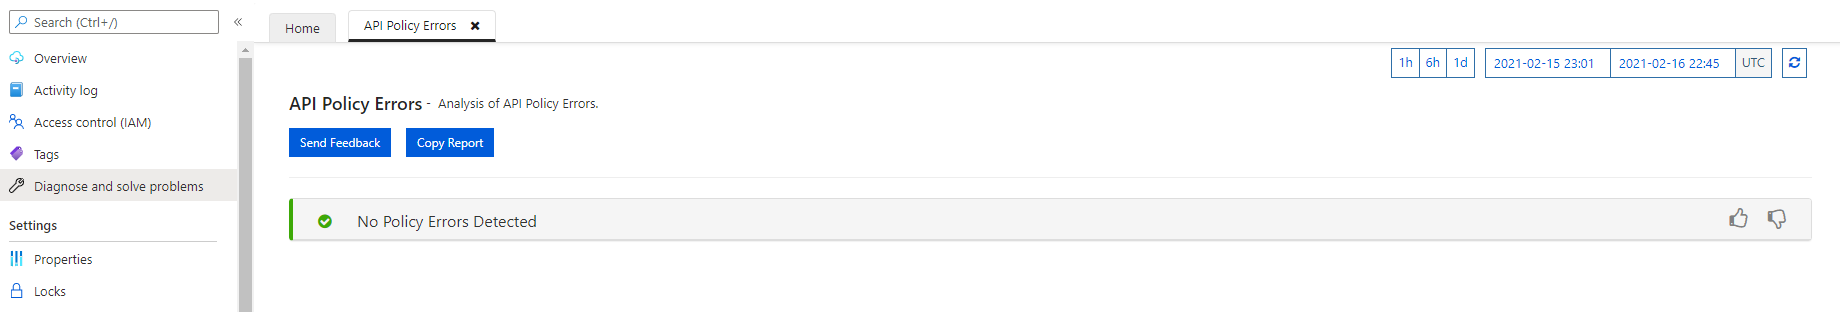
API policies
This category detects errors and notifies you of your policy issues.
An interactive interface guides you to the data metrics to help you troubleshoot your API policies configuration.
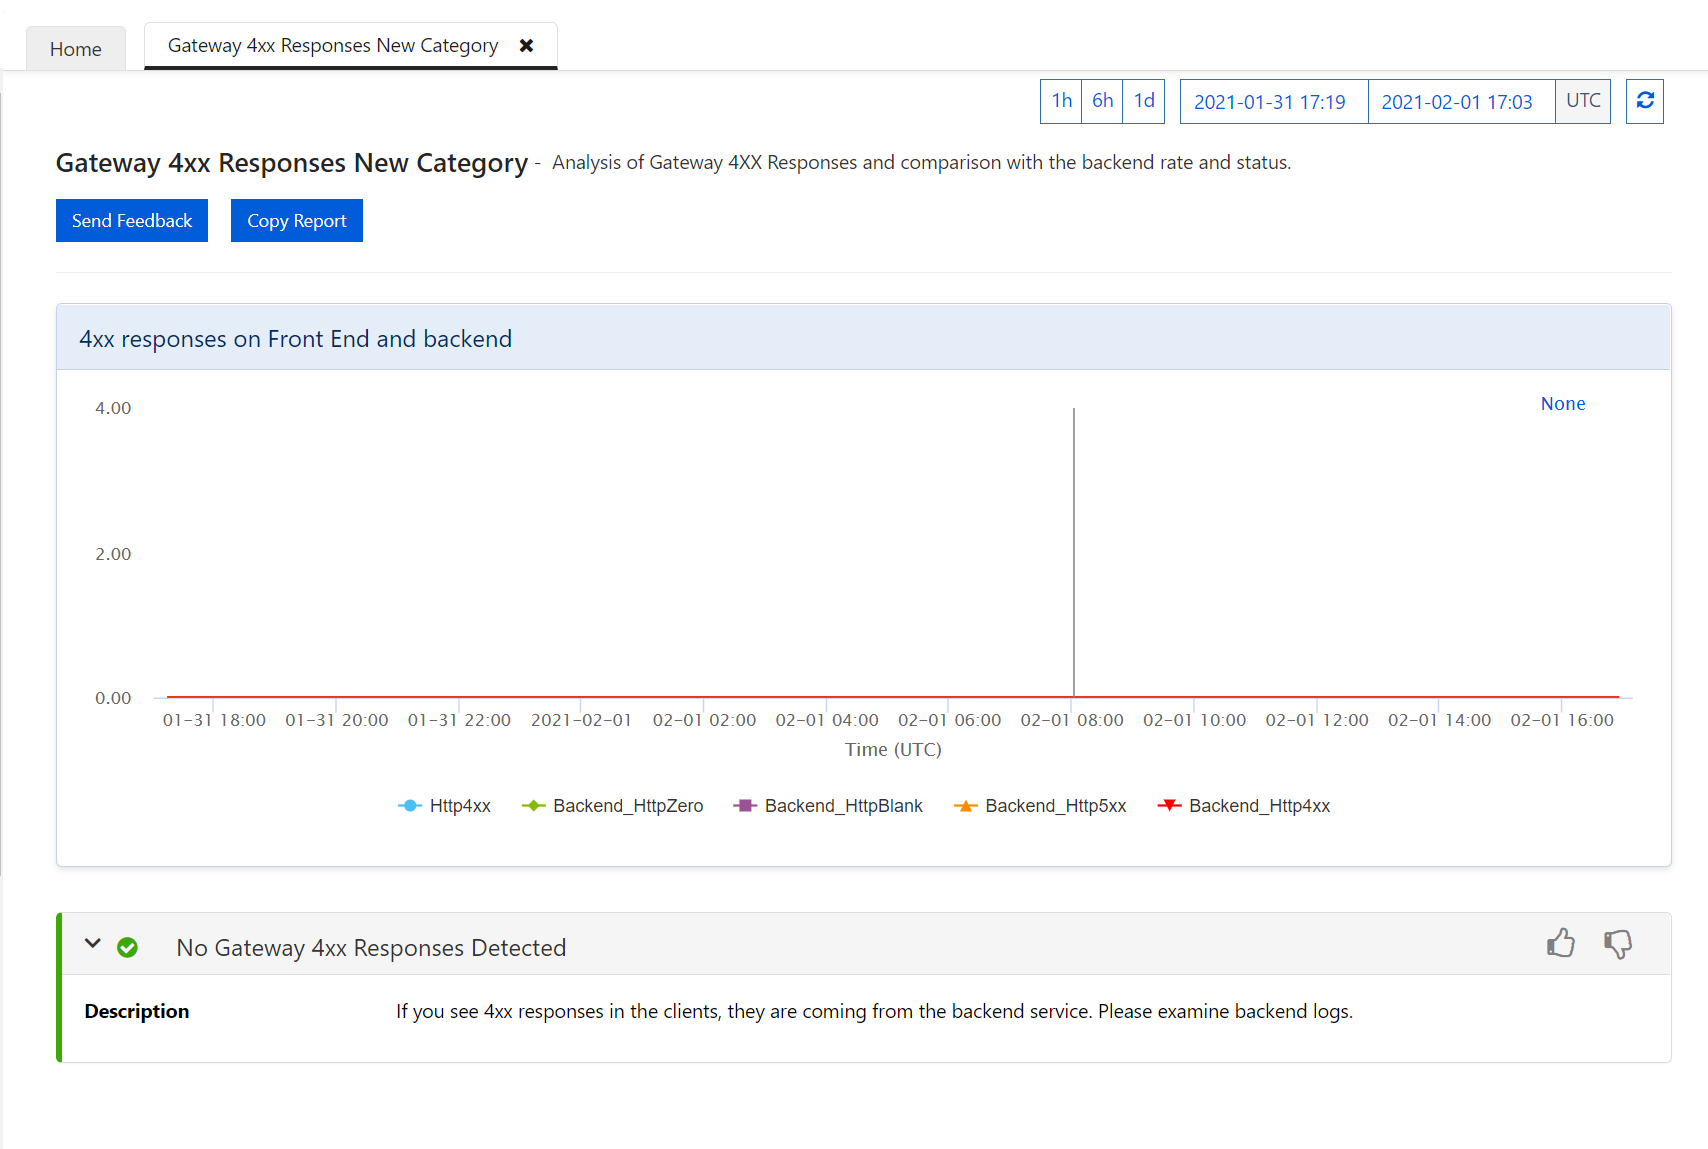
Gateway performance
For gateway requests or responses or any 4xx or 5xx errors on your gateway, use this category to monitor and troubleshoot. Similarly, use the interactive interface to dive deep into the specific area that you want to check for your API gateway performance.
Service upgrade
This category checks which service tier (SKU) you're currently using and reminds you to upgrade to avoid any issues that might be related to that tier. The interactive interface helps you go deep with more graphics and a summary check result.
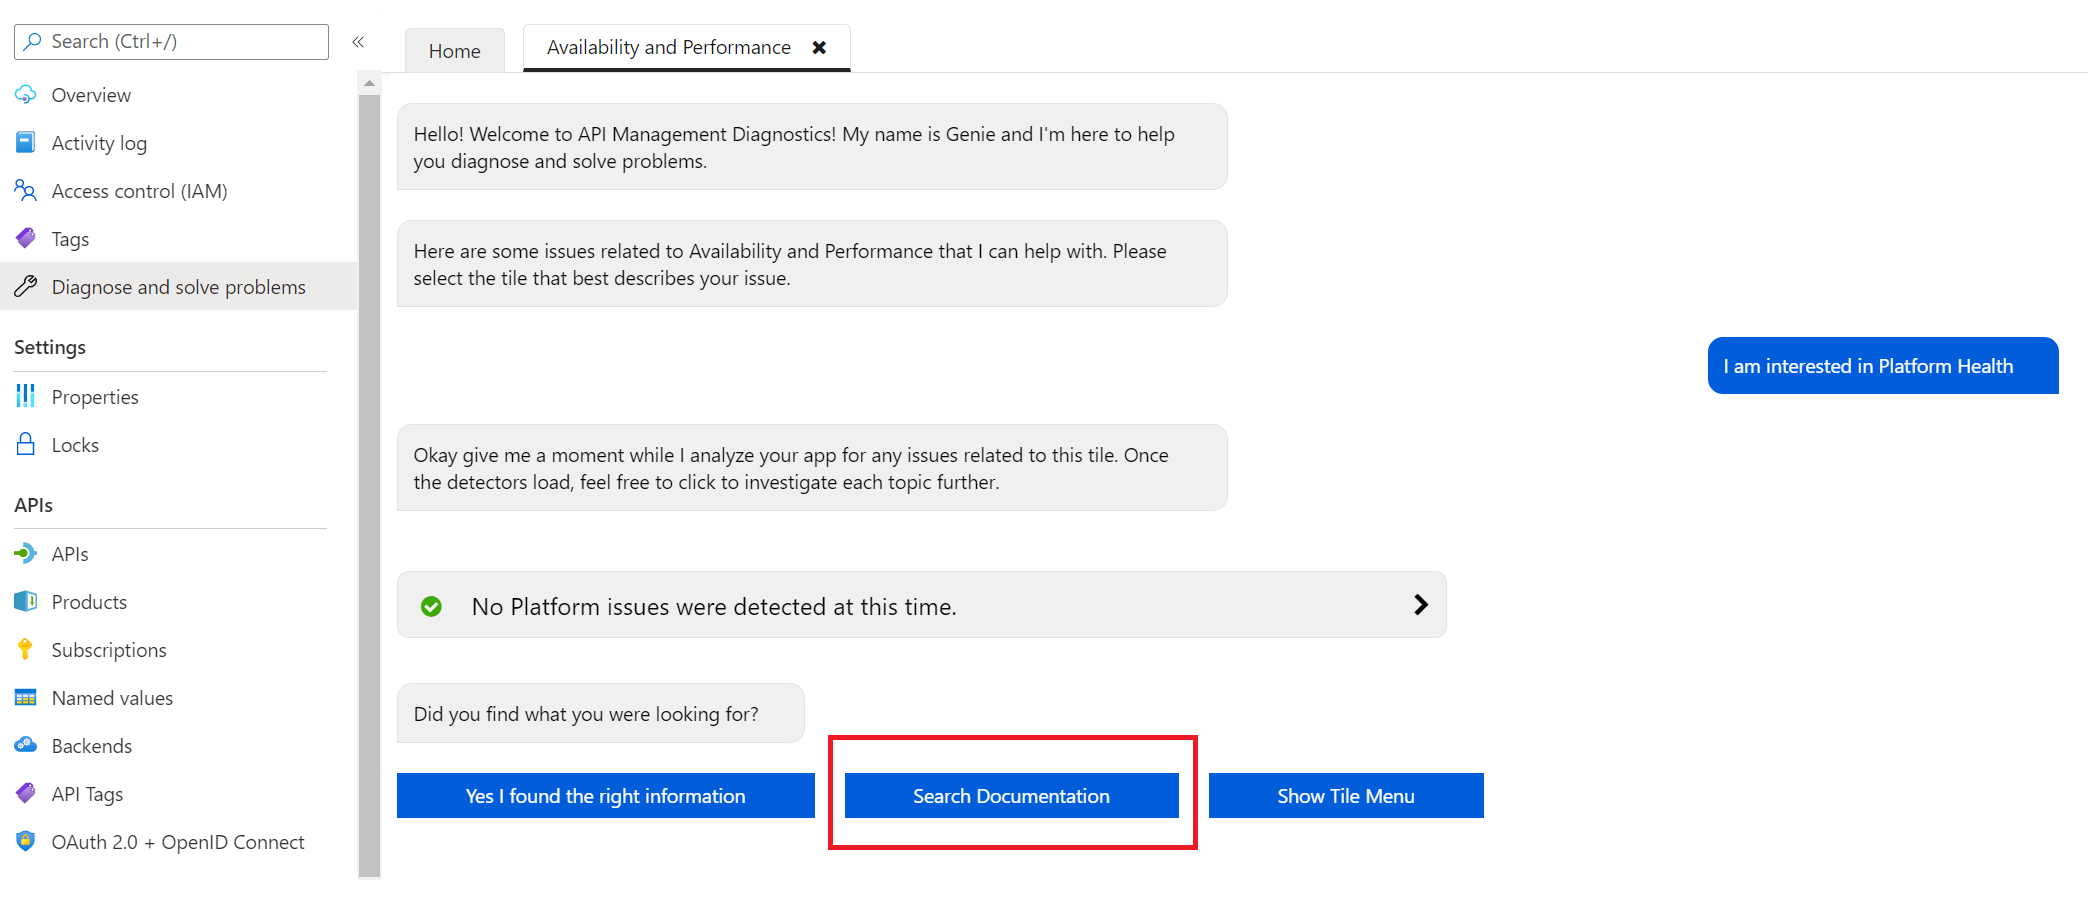
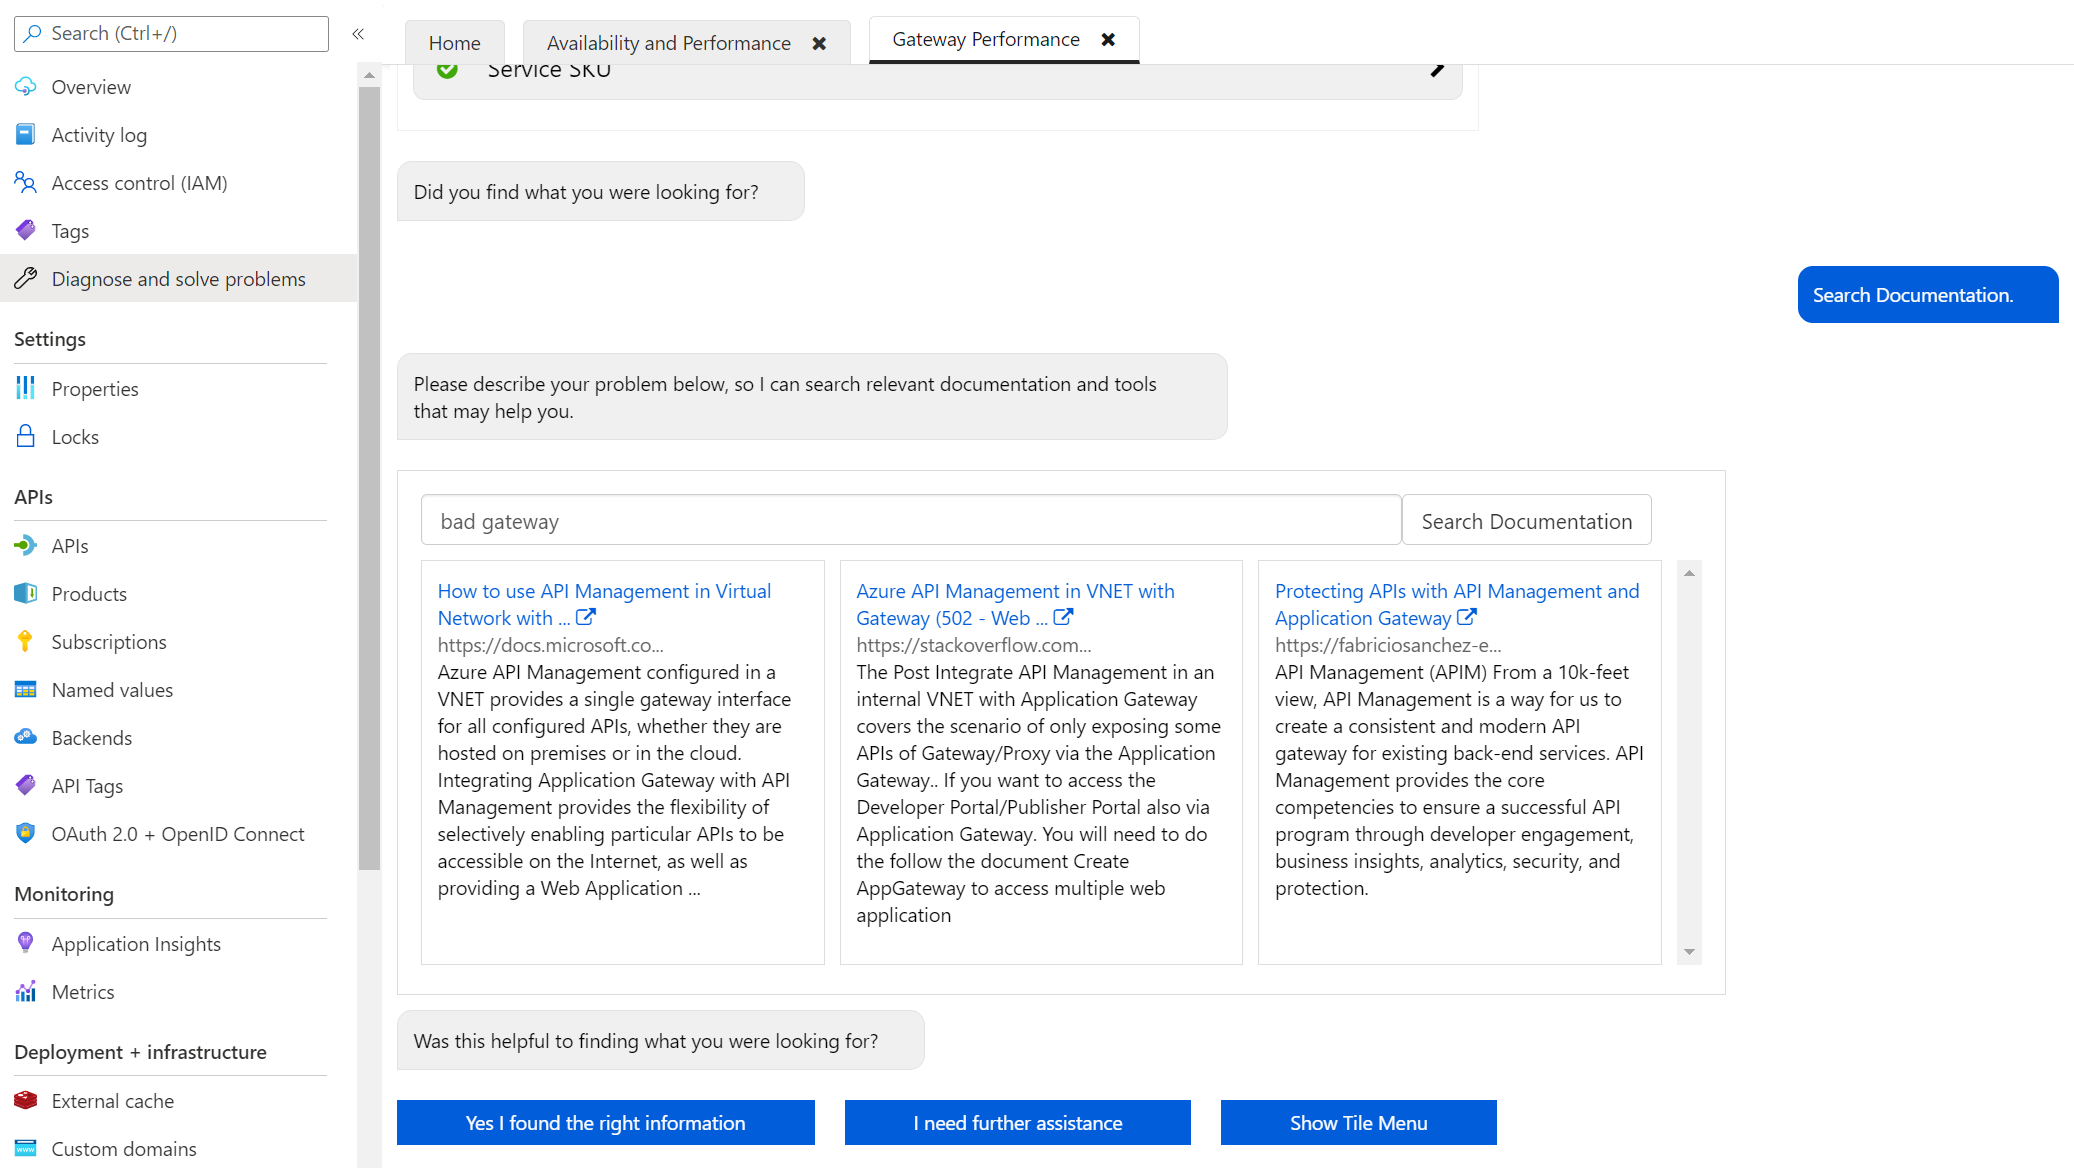
Search documentation
In addition to the Diagnose and solve problems tools, you can search for troubleshooting documentation related to your issue. After running the diagnostics on your service, select Search Documentation in the interactive interface.