Provide anomaly feedback
Important
Starting on the 20th of September, 2023 you won’t be able to create new Metrics Advisor resources. The Metrics Advisor service is being retired on the 1st of October, 2026.
User feedback is one of the most important methods to discover defects within the anomaly detection system. Here we provide a way for users to mark incorrect detection results directly on a time series, and apply the feedback immediately. In this way, a user can teach the anomaly detection system how to do anomaly detection for a specific time series through active interactions.
Note
Currently feedback will only affect anomaly detection results by Smart detection but not Hard threshold and Change threshold.
How to give time series feedback
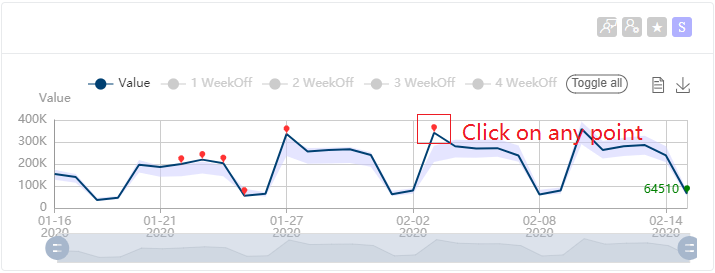
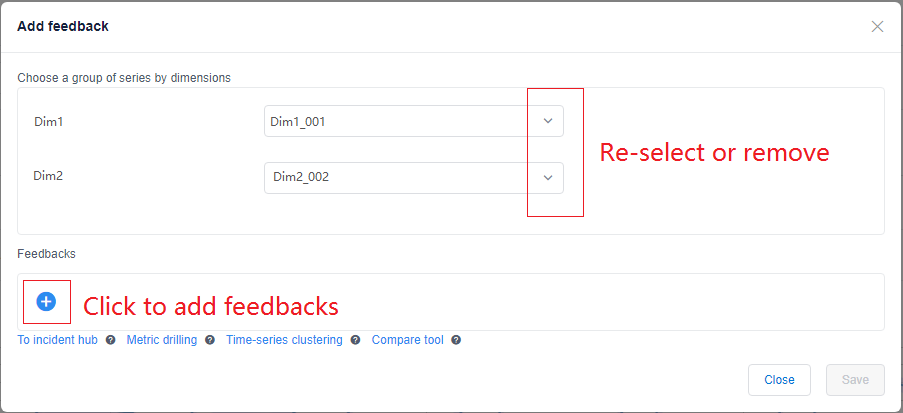
You can provide feedback from the metric detail page on any series. Just select any point, and you will see the below feedback dialog. It shows you the dimensions of the series you've chosen. You can reselect dimension values, or even remove some of them to get a batch of time series data. After choosing time series, select the Add button to add the feedback, there are four kinds of feedback you could give. To append multiple feedback items, select the Save button once you complete your annotations.
Mark the anomaly point type
As shown in the image below, the feedback dialog will fill the timestamp of your chosen point automatically, though you can edit this value. You then select whether you want to identify this item as an Anomaly, NotAnomaly, or AutoDetect.
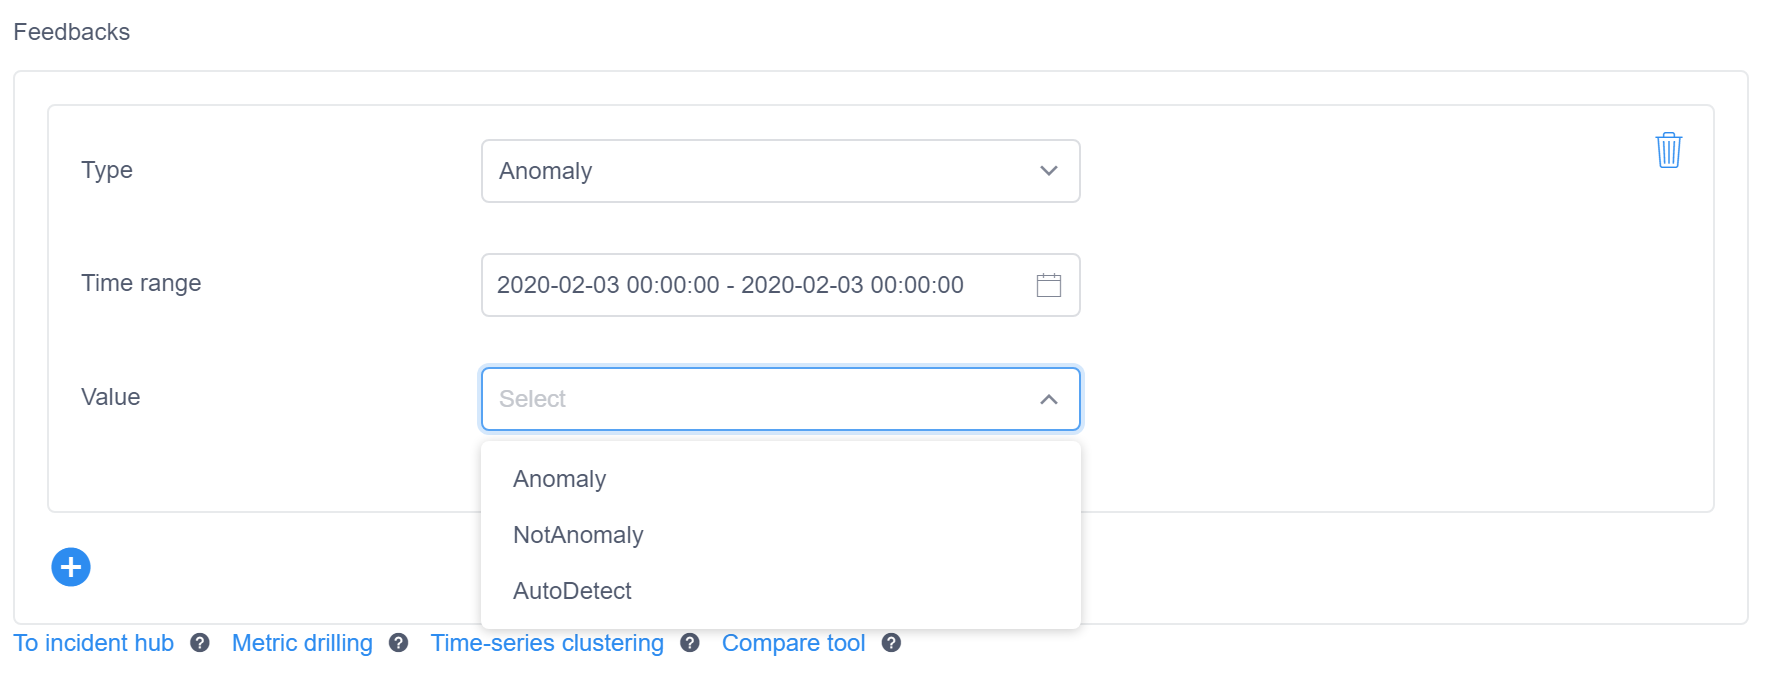
The selection will apply your feedback to the future anomaly detection processing of the same series. The processed points will not be recalculated. That means if you marked an Anomaly as NotAnomaly, we will suppress similar anomalies in the future, and if you marked a NotAnomaly point as Anomaly, we will tend to detect similar points as Anomaly in the future. If AutoDetect is chosen, any previous feedback on the same point will be ignored in the future.
Provide feedback for multiple continuous points
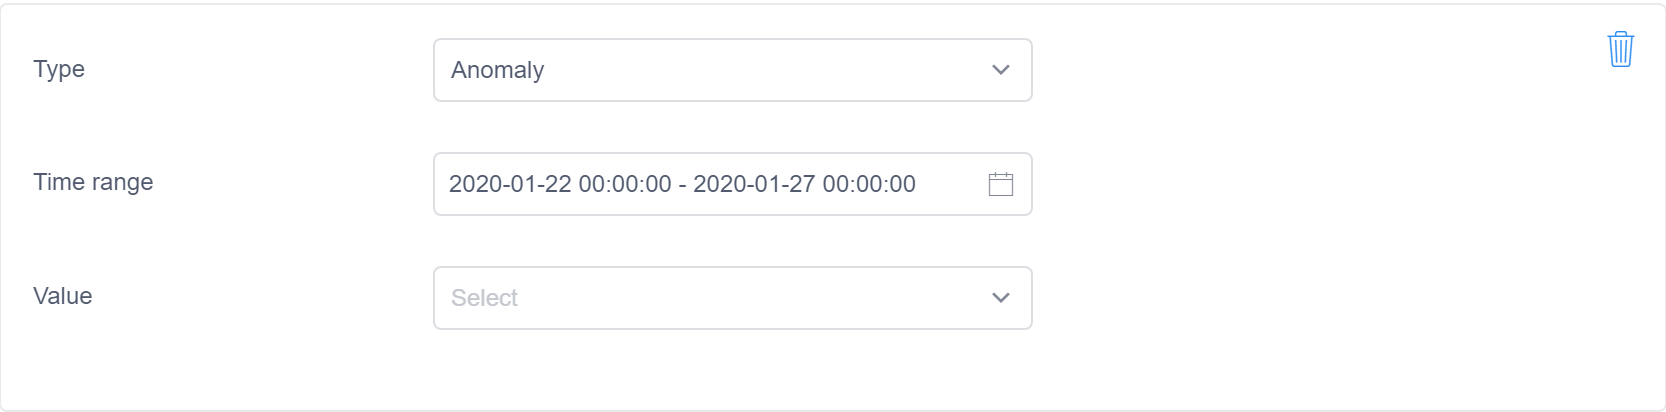
If you would like to give anomaly feedback for multiple continuous points at the same time, select the group of points you want to annotate. You will see the chosen time-range automatically filled when you provide anomaly feedback.
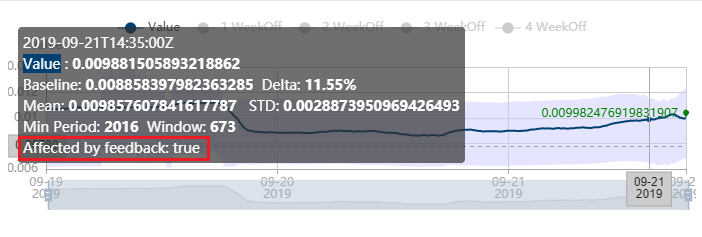
To view if an individual point is affected by your anomaly feedback, when browsing a time series, select a single point. If its anomaly detection result has been changed by feedback, the tooltip will show Affected by feedback: true. If it shows Affected by feedback: false, this means an anomaly feedback calculation was performed for this point, but the anomaly detection result should not be changed.
There are some situations where we do not suggest giving feedback:
- The anomaly is caused by a holiday. It's suggested to use a preset event to solve this kind of false alarm, as it will be more precise.
- The anomaly is caused by a known data source change. For example, an upstream system change happened at that time. In this situation, it is expected to give an anomaly alert since our system didn't know what caused the value change and when similar value changes will happen again. Thus we don't suggest annotating this kind of issue as
NotAnomaly.
Change points
Sometimes the trend change of data will affect anomaly detection results. When a decision is made as to whether a point is an anomaly or not, the latest window of history data will be taken into consideration. When your time series has a trend change, you could mark the exact change point, this will help our anomaly detector in future analysis.
As the figure below shows, you could select ChangePoint for the feedback Type, and select ChangePoint, NotChangePoint, or AutoDetect from the pull-down list.

Note
If your data keeps changing, you will only need to mark one point as a ChangePoint, so if you marked a timerange, we will fill the last point's timestamp and time automatically. In this case, your annotation will only affect anomaly detection results after 12 points.
Seasonality
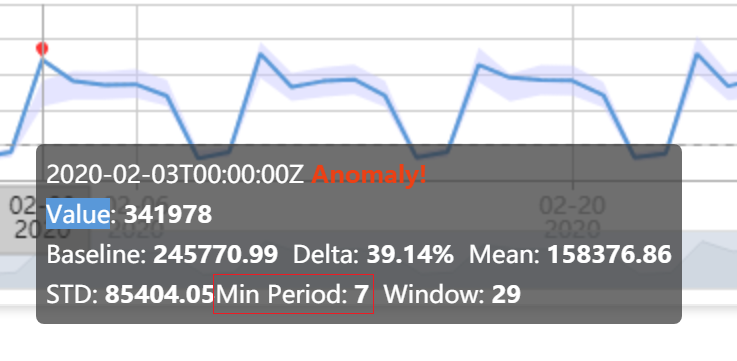
For seasonal data, when we perform anomaly detection, one step is to estimate the period(seasonality) of the time series, and apply it to the anomaly detection phase. Sometimes, it's hard to identify a precise period, and the period may also change. An incorrectly defined period may have side effects on your anomaly detection results. You can find the current period from a tooltip, its name is Min Period. Window is a recommended window size to detect the last point within the window. Window usually is (Min Period × 4 ) + 1.
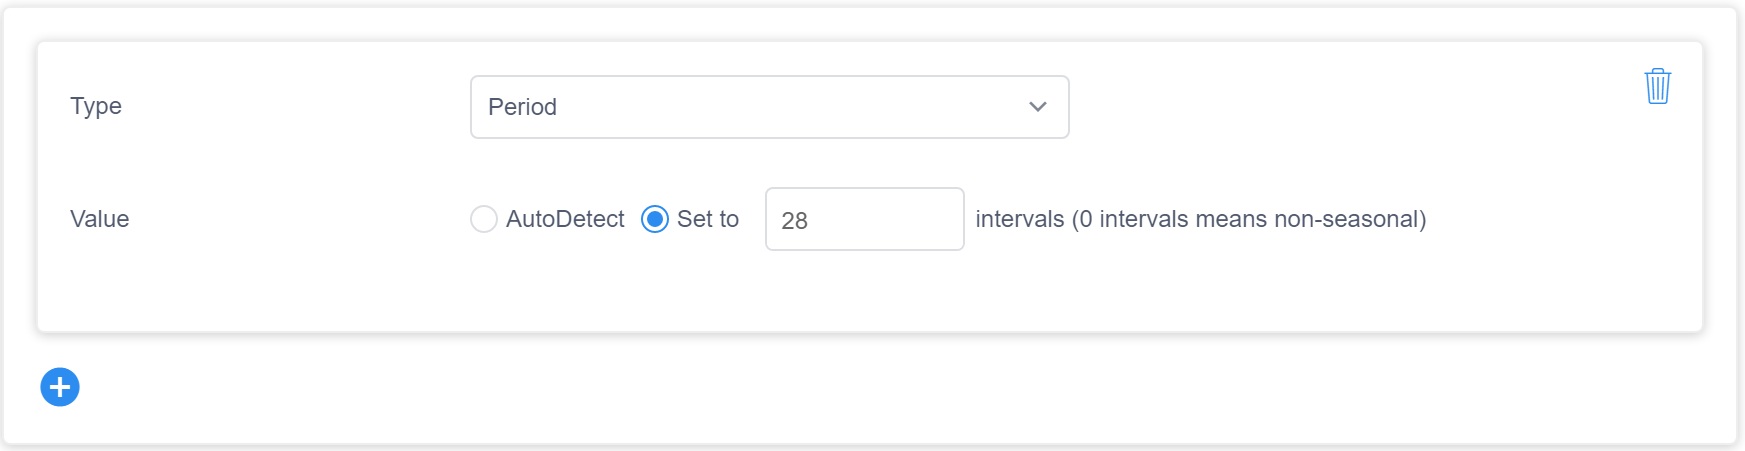
You can provide feedback for period to fix this kind of anomaly detection error. As the figure shows, you can set a period value. The unit interval means one granularity. Here zero intervals means the data is non-seasonal. You could also select AutoDetect if you want to cancel previous feedback and let the pipeline detect period automatically.
Note
When setting period you do not need to assign a timestamp or timerange, the period will affect future anomaly detections on whole timeseries from the moment you give feedback.
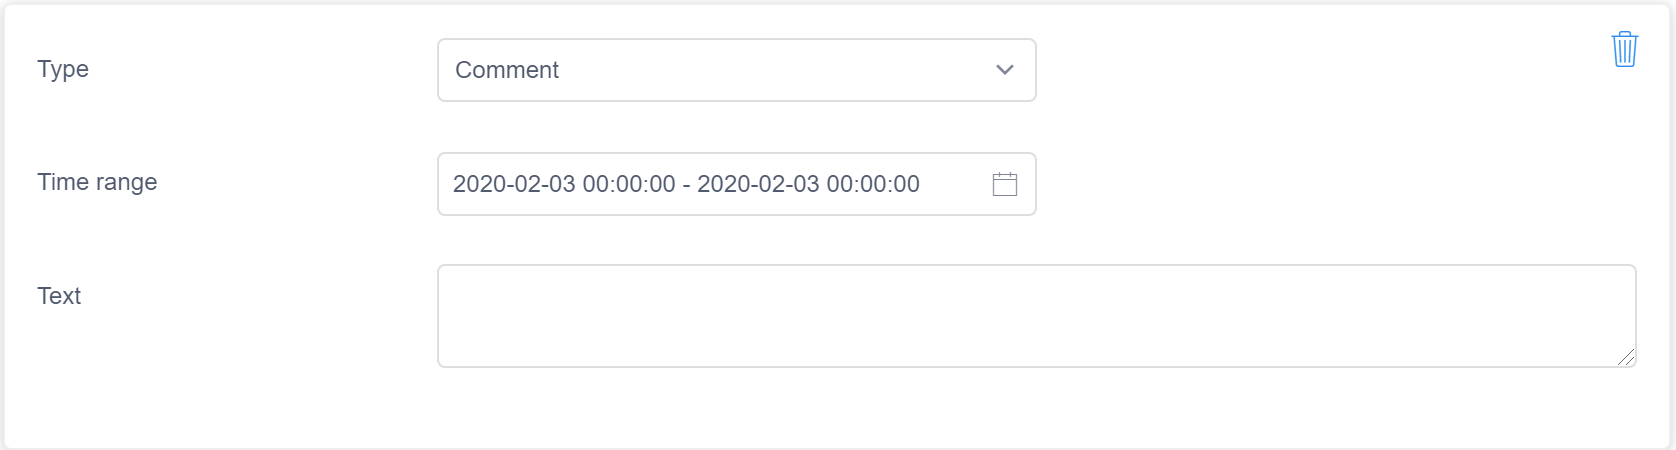
Provide comment feedback
You can also add comments to annotate and provide context to your data. To add comments, select a time range and add the text for your comment.
Time series batch feedback
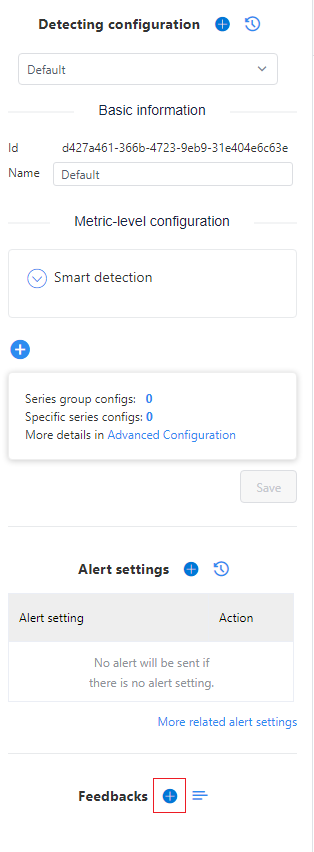
As previously described, the feedback modal allows you to reselect or remove dimension values, to get a batch of time series defined by a dimension filter. You can also open this modal by clicking the "+" button for Feedback from the left panel, and select dimensions and dimension values.

How to view feedback history
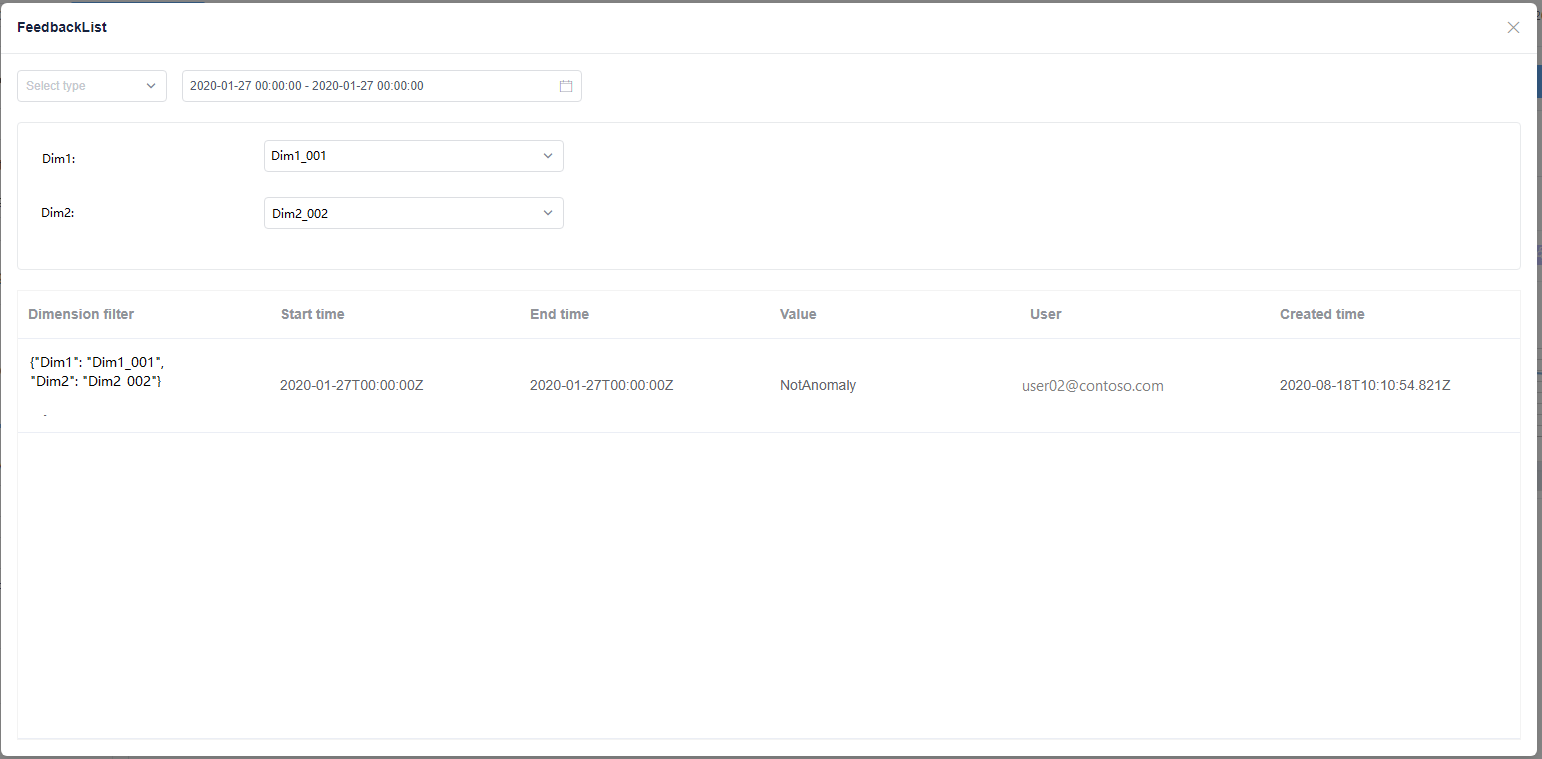
There are two ways to view feedback history. You can select the feedback history button from the left panel, and will see a feedback list modal. It lists all the feedback you've given before either for single series or dimension filters.
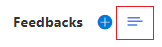
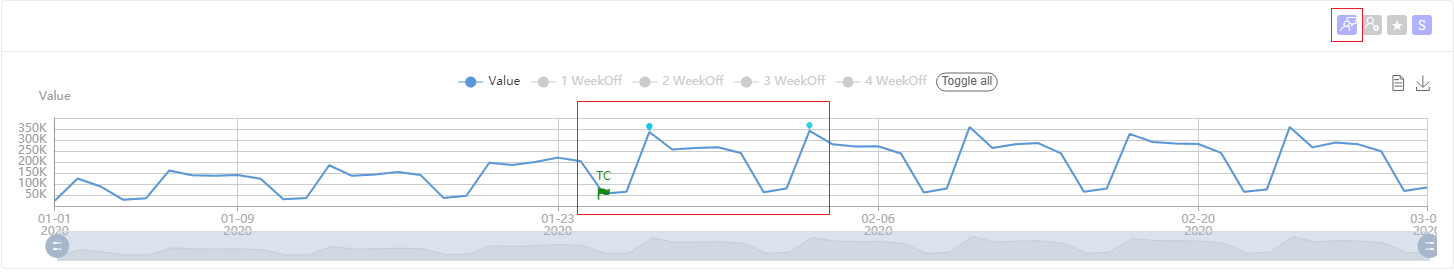
Another way to view feedback history is from a series. You will see several buttons on the upper right corner of each series. Select the show feedback button, and the line will switch from showing anomaly points to showing feedback entries. The green flag represents a change point, and the blue points are other feedback points. You could also select them, and will get a feedback list modal that lists the details of the feedback given for this point.
Note
Anyone who has access to the metric is permitted to give feedback, so you may see feedback given by other datafeed owners. If you edit the same point as someone else, your feedback will overwrite the previous feedback entry.