Caution
This article references CentOS, a Linux distribution that is nearing End Of Life (EOL) status. Please consider your use and plan accordingly. For more information, see the CentOS End Of Life guidance.
This article briefly describes the steps for running the Autodesk VRED Core application on a virtual machine (VM) deployed on Azure. It also presents the performance results of running Autodesk VRED Core on Azure.
VRED Core targets new workflows and connects you with your data anytime, anywhere, through the cloud and while streaming. VRED Core:
- Provides scalable, ray tracing capabilities that allow full flexibility to scale GPU and CPU rendering needs, according to hardware setup.
- Enables streaming of high quality, VRED real-time renderings on any device, for management reviews and for internal or customer-facing visualization systems.
- Integrates with existing rendering systems. You can also customize it for your specific needs and extend where more functionality is needed.
VRED Core is primarily used by automotive designers and digital artists, technical surfacing specialists, visualization specialists, lighting engineers, perceived quality specialists, virtual reality specialists, digital marketing professionals, and CGI artists.
Why deploy Autodesk VRED Core on Azure?
Azure provides:
- Modern and diverse compute options to align to your workload's needs.
- The ability to run in the cloud, which reduces capital expenditure (CapEx) and lead time associated with acquiring on-premises infrastructure.
- Rapid provisioning.
- Strong GPU acceleration, with increased performance as GPUs are added.
Architecture
Download a Visio file of this architecture.
Components
Azure Virtual Machines is used to create Windows VMs. For information about deploying a VM and installing drivers, see Run a Windows VM on Azure.
Azure Virtual Network is used to create a private network infrastructure in the cloud.
Network security groups restrict access to VMs at the subnet level.
A public IP address provides users with access to VRED Core via the internet.
Azure Disk Storage provides high-performance, durable block storage for VMs.
Azure Virtual Machine Scale Sets provides a way to manage a group of VMs. The number of VMs in a set can automatically increase or decrease in response to demand or a defined schedule.
Deploy infrastructure and install VRED Core
Deploy Azure VMs. Before you install VRED Core, deploy your Azure VMs. Use a NVadsA10_v5-series VM and a NCasT4_v3 series VM to run VRED Core. Make sure the VMs meet the system requirements when you install the application.
Create and configure the supporting infrastructure. Configure a public IP address for inbound connectivity. Use network security groups to provide security for the subnet.
Install NVIDIA drivers. To take advantage of the GPU capabilities of NVadsA10_v5-series VMs and NCasT4_v3 series VMs, install NVIDIA GPU drivers. For information about deploying VMs and installing the drivers, see Run a Windows VM on Azure and Run a Linux VM on Azure.
Compute sizing and drivers
Performance tests of VRED Core on Azure used NVadsA10_v5-series and NCasT4_v3 series VMs. The following table provides the configuration details.
| Size | vCPU | Memory: GiB | Temp storage (SSD) GiB | GPU partition | GPU memory: GiB | Max data disks |
|---|---|---|---|---|---|---|
| Standard_NV6ads_A10_v5 | 6 | 55 | 180 | 1/6 | 4 | 4 |
| Standard_NV12ads_A10_v5 | 12 | 110 | 360 | 1/3 | 8 | 4 |
| Standard_NV18ads_A10_v5 | 18 | 220 | 720 | 1/2 | 12 | 8 |
| Standard_NV36ads_A10_v5 | 36 | 440 | 720 | 1 | 24 | 16 |
| Standard_NV72ads_A10_v5 | 72 | 880 | 1400 | 2 | 48 | 32 |
| Standard_NC4as_T4_v3 | 4 | 28 | 180 | 1 | 16 | 8 |
| Standard_NC8as_T4_v3 | 8 | 56 | 360 | 1 | 16 | 16 |
| Standard_NC16as_T4_v3 | 16 | 110 | 360 | 1 | 16 | 32 |
| Standard_NC64as_T4_v3 | 64 | 440 | 2880 | 4 | 64 | 32 |
Autodesk VRED Core installation
Before you install Autodesk VRED Core, deploy and connect a VM and install the required NVIDIA drivers.
You can install VRED Core from the Autodesk VRED Core portal. For the detailed installation procedure, see Autodesk VRED Core Help.
Autodesk VRED Core performance results
This performance analysis uses the Autodesk VRED Core 2024 version on Linux NVadsA10 v5 series VMs and NCasT4_v3 series VMs.
The following table provides the details about the testing operating system.
| VM Name | Operating system | Architecture | Processor |
|---|---|---|---|
| Standard_NVads_A10_v5 | Linux CentOS-HPC 8.1 Gen2 | x64 | AMD EPYC 74F3V (Milan) |
| Standard_NCas_T4_v3 | Linux CentOS-HPC 8.1 Gen2 | x64 | AMD EPYC 7V12 (Rome) |
The following Automotive_Genesis model is used for testing:
| Model Name | Sample size | Render size |
|---|---|---|
| Automotive_Genesis | 2048 | 5100x3300 @ 300 dpi (11x17 inch) |
Results on NVadsA10_v5
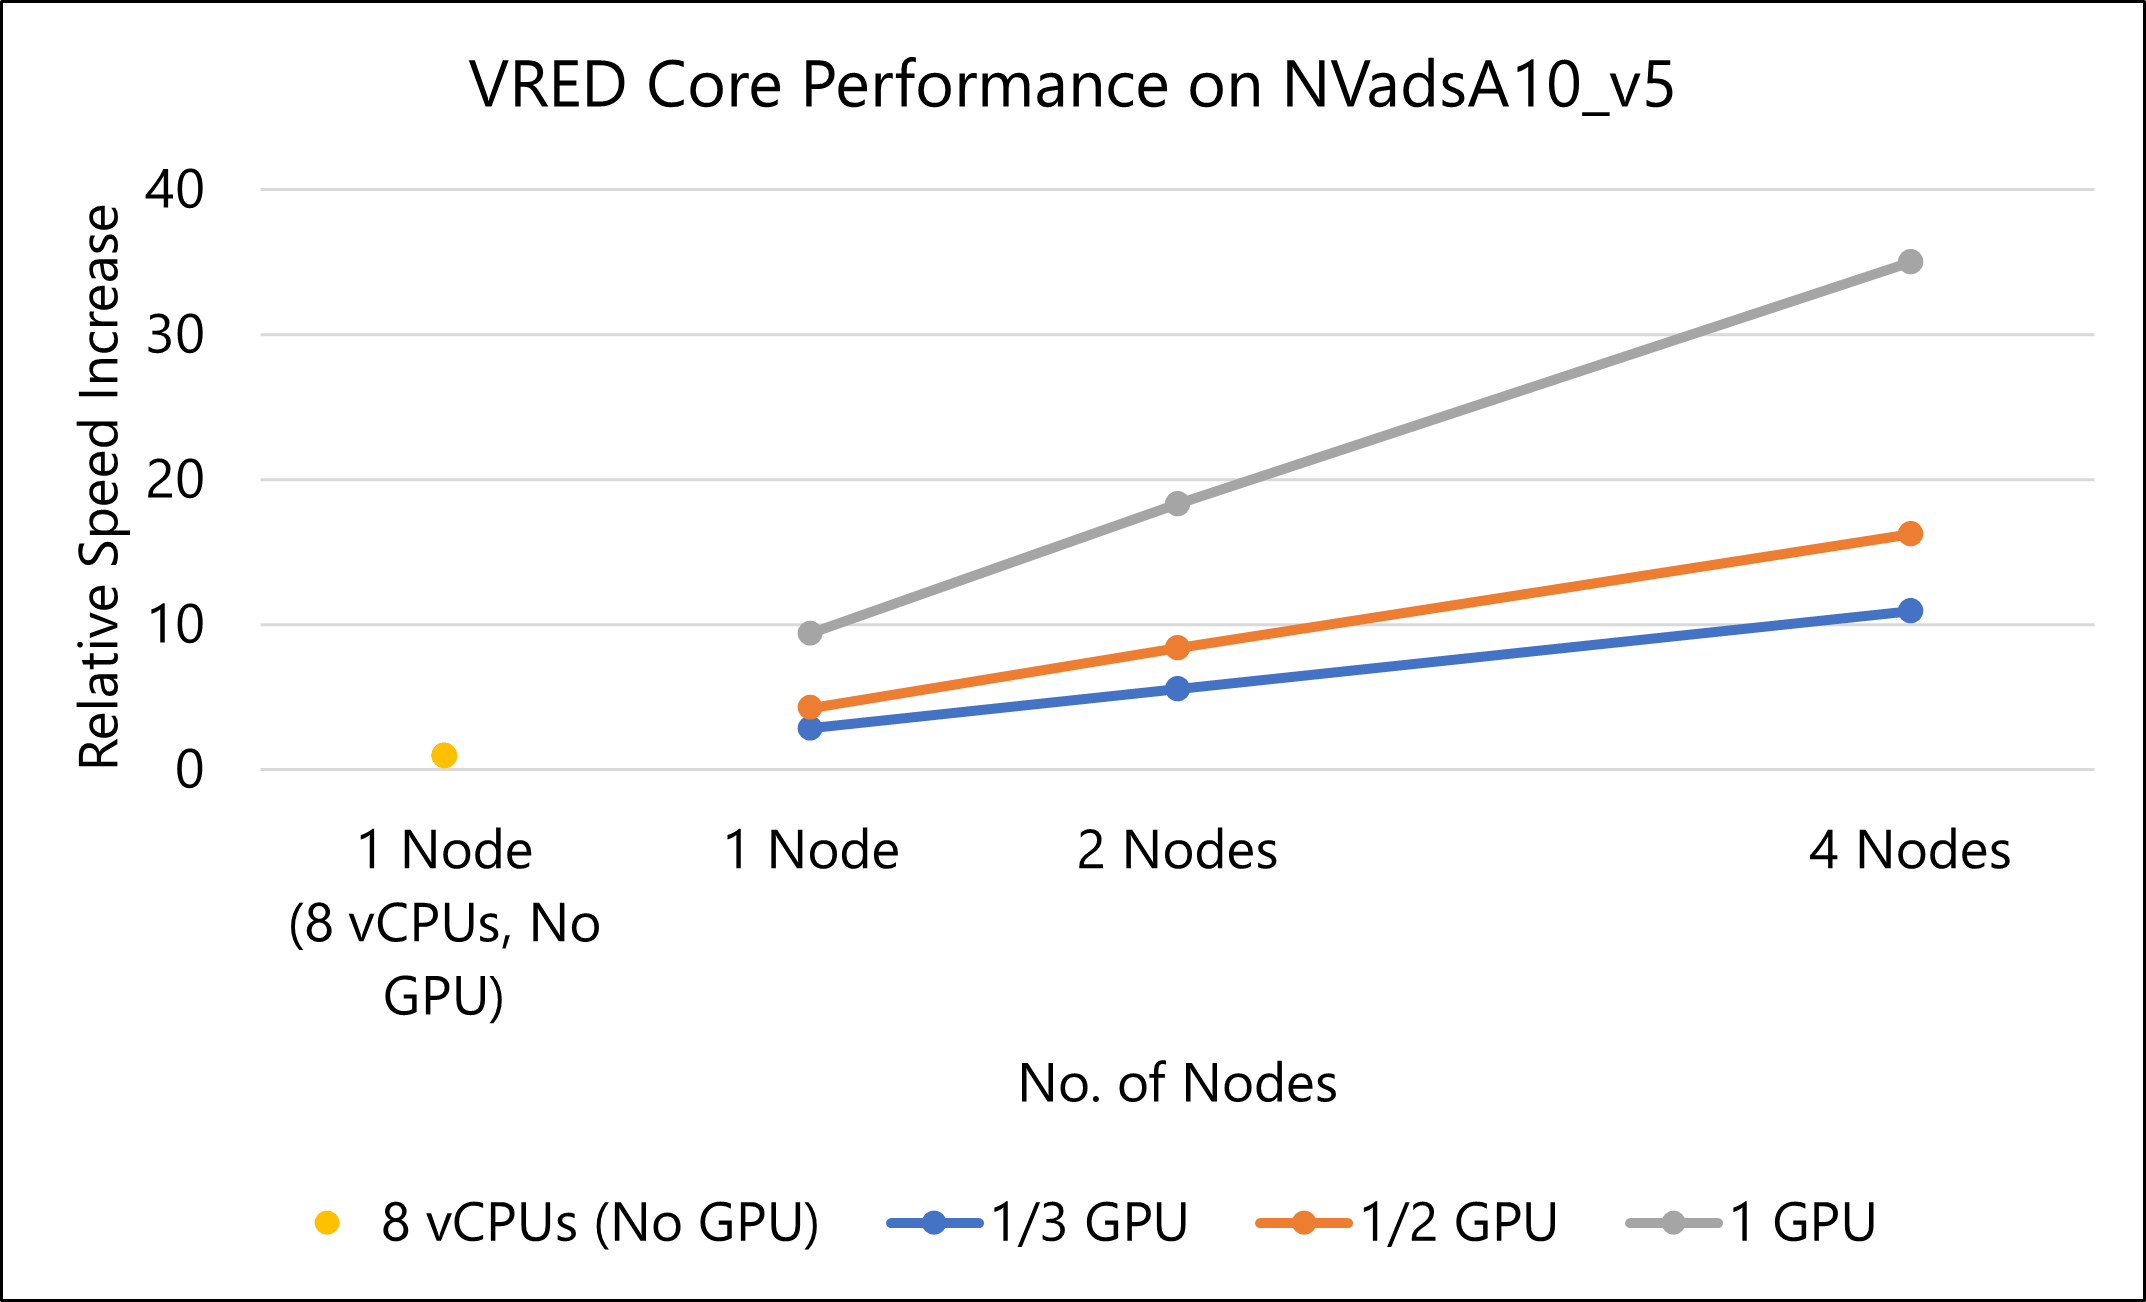
The following table shows the render time in seconds for various number of nodes of NVadsA10_v5 series VM instances. The results for a NCasT4_v3 series VM with 8 vCPUs (cores) serve as the baseline for determining relative speed increase.
| VM Name | Number of nodes | Number of vCPUs | Number of GPUs | Render time (sec) | Relative speed increase |
|---|---|---|---|---|---|
| Standard_NC8as_T4_v3 | 1 | 8 | - | 17011.12 | 1.00 |
| Standard_NV12adsA10_v5 | 1 | 12 | 1/3 | 5971.23 | 2.85 |
| 2 | 24 | 1/3 x2 | 3052.226 | 5.57 | |
| 4 | 48 | 1/3 x4 | 1553.495 | 10.95 | |
| Standard_NV18adsA10_v5 | 1 | 18 | 1/2 | 3980.087 | 4.27 |
| 2 | 36 | 1/2 x2 | 2023.638 | 8.41 | |
| 4 | 72 | 1/2 x4 | 1046.551 | 16.25 | |
| Standard_NV36adsA10_v5 | 1 | 36 | 1 | 1812.373 | 9.39 |
| 2 | 72 | 2 | 927.448 | 18.34 | |
| 4 | 144 | 4 | 485.853 | 35.01 |
The following graph shows the relative speed increase as the number of nodes increases:
More notes about tests on NVadsA10_v5
- The results are assessed based on relative performance, where higher values indicate better performance.
- An error occurs while running the model in the NCasT4_v3 series VM with a minimum configuration of only 4 vCPUs (cores). So, the results of a VM with 8 vCPUs were considered for the baseline.
Results on NCasT4_v3
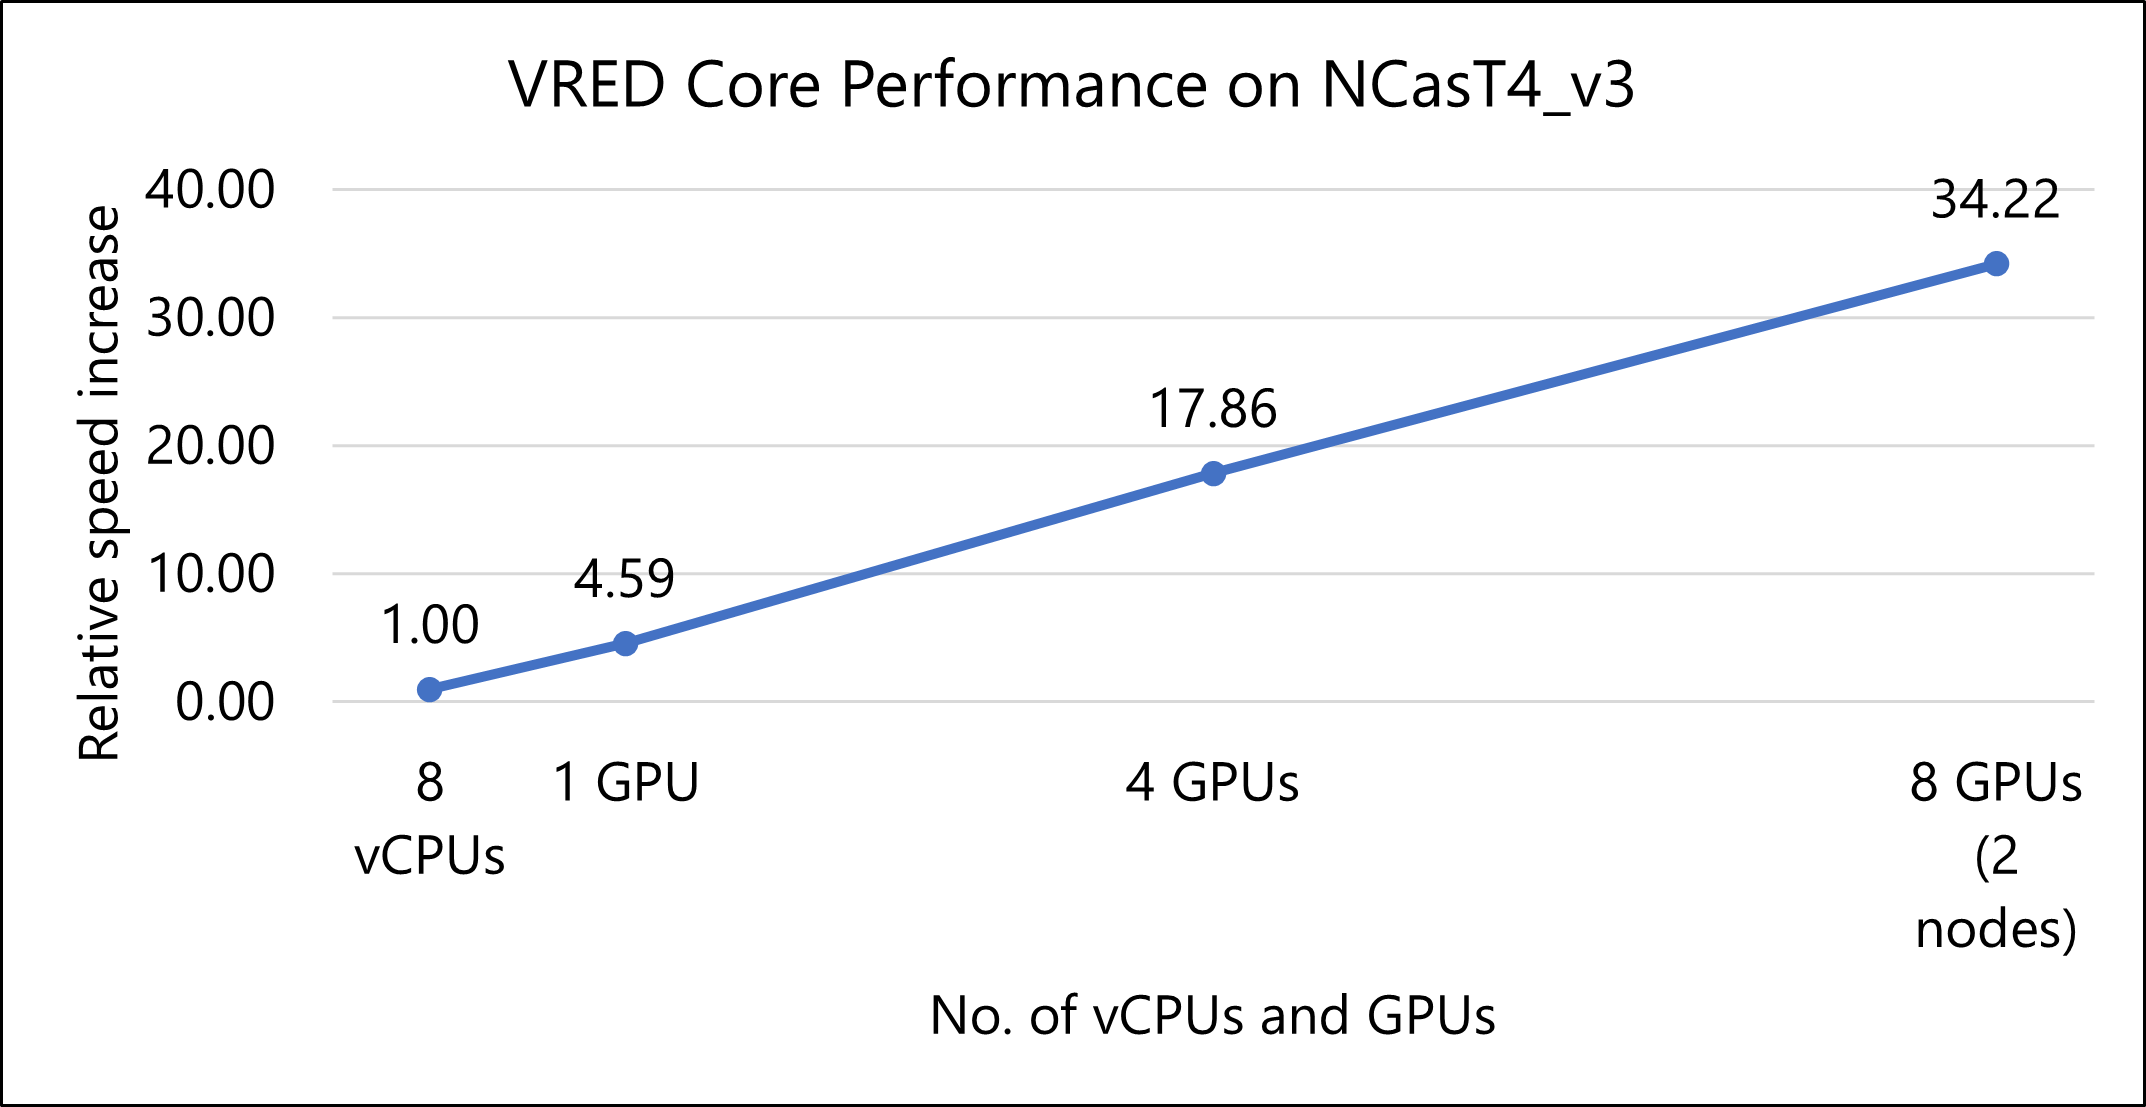
The following table shows the render time in seconds for various available NCasT4_v3 series VM instances. The results for a NCasT4_v3 series VM with 8 vCPUs (cores) serve as the baseline for computing the relative speed increase of the rest of the instances.
| VM Name | Number of nodes | Number of vCPUs | Number of GPUs | Render time (sec) | Relative speed increase |
|---|---|---|---|---|---|
| Standard_NC8as_T4_v3 | 1 | 8 | 0 | 17011.12 | 1.00 |
| Standard_NC4as_T4_v3 | 1 | 4 | 1 | 3704.536 | 4.59 |
| Standard_NC64as_T4_v3 | 1 | 64 | 4 | 952.249 | 17.86 |
| Standard_NC64as_T4_v3 | 2 | 128 | 8 | 497.054 | 34.22 |
The following graph shows the relative speed increases as the number of GPU increases:
More notes about tests on NCasT4_v3
- The results are assessed based on relative performance, where higher values indicate better performance.
- An error occurs while running the model in the NCasT4_v3 series VM with a minimum configuration of only 4 vCPUs (cores). So, the results of a VM with 8 vCPUs were considered for the baseline.
Azure cost
For these cost calculations, only model rendering time is considered. Application installation time isn't considered. The calculations are indicative of your potential results. The actual cost depends on the size of the model. You can use the Azure pricing calculator to estimate costs for your configuration.
The following paragraph provides details about the cost consumption on various SKUs:
NVadsA10_v5 series (NVIDIA A10 GPU)
- A standard_NV12ads_A10_v5 VM instance is the baseline to evaluate the cost performance of other instances considered in the NVadsA10_v5 series.
- Linear scalability is observed for both performance and Azure cost for every change in size increment for NVadsA10_v5 series (single-node and multi-node runs).
- The cost increase is about 1.25 times as the configuration of the VM scales from single node to multi node of Standard_NV12ads_A10_v5 (1/3 GPU) to Standard_NV36ads_A10_v5 (one GPU) VMs size. The associated performance increment of about 13 times is observed.
- NVadsA10_v5 series (1/3 GPU) VM is a preferred choice when you consider cost as the primary criteria of evaluation.
NCasT4_v3 series (NVIDIA Tesla T4 GPU)
- A standard_NC4as_T4_v3 VM instance is considered as a baseline to evaluate the cost performance of other instances considered in the NCasT4_v3 series.
- Standard_NC4as_T4_v3 is considered for one GPU runs and Standard_NC64as_T4_v3 is considered for four GPUs (one node) and eight GPUs (two nodes) runs.
- A cost increase of about 2.2 times is observed as we increase the size of the VM from Standard_NC4as_T4_v3 to Standard_NC64as_T4_v3 (four GPUs & eight GPUs). The associated performance increment of about 7.5 times is observed.
- Standard_NC4as_T4_v3 (one GPU) VM is a preferred choice when you consider cost as the primary criteria of evaluation.
For latest pricing details in each region, use the Azure pricing calculator.
Summary
- When you prioritize performance, the NVadsA10_v5 series is the preferred choice. For cost-effectiveness, the NCasT4_v3 series offers the best value.
- Autodesk VRED Core demonstrates strong scalability on Azure HPC VMs, particularly on NVadsA10_v5 and NCasT4_v3 series, which utilize NVIDIA A10 and NVIDIA Tesla T4 graphics cards, respectively.
- A notable performance increase of approximately 35 times is achieved in both the NVadsA10_v5 and NCasT4_v3 series VMs as the configuration scales from a single node to multiple nodes.
- For the NVadsA10v5 series, performance improvements are as follows:
- About 2.5 times increase from a single node to four nodes using VMs with one-third of a GPU.
- Approximately four times increase from a single node to four nodes with VMs using half a GPU.
- Nearly nine times increase from a single node to four nodes with VMs utilizing a full GPU.
- The Standard_NV36ads_A10_v5 VM shows superior performance over other NVadsA10_v5 series VMs that use partial GPU configurations.
- The NCasT4_v3 series shows:
- About four times performance increase when expanding from one GPU to four GPUs.
- Approximately two times increase when going from four GPUs on a single node to eight GPUs across two nodes.
- Overall, VMs that have the latest NVIDIA graphics cards deliver enhanced performance, offering a balance of cost efficiency and computing power.
Contributors
This article is maintained by Microsoft. It was originally written by the following contributors.
Principal authors:
- Hari Bagudu | Senior Manager
- Gauhar Junnarkar | Principal Program Manager
- Amol Rane | HPC Performance Engineer
Other contributors:
- Guy Bursell | Director Business Strategy
- Sachin Rastogi | Manager
To see nonpublic LinkedIn profiles, sign in to LinkedIn.
Next steps
- GPU-optimized virtual machine sizes
- Virtual machines in Azure
- Virtual networks and virtual machines in Azure
- Training path: Run high-performance computing (HPC) applications on Azure
- Azure Virtual Machine Scale Sets


